
In case the Bulls defend the demand level of $0.30, XRP price may rise towards the previous high or touch the upper drawn trend line. Increase in the pressure of the Bears may break down the $0.30 level and expose $0.28 level.
Key Highlights:
- XRP is under the Bearish pressure;
- the XRP price may rise;
- the breakdown of the $0.30 level will expose $0.28.
XRP/USD Price Medium-term Trend: Bearish
Supply levels: $0.31, $0.33, $0.34
Demand levels: $0.30, $0.28, $0.27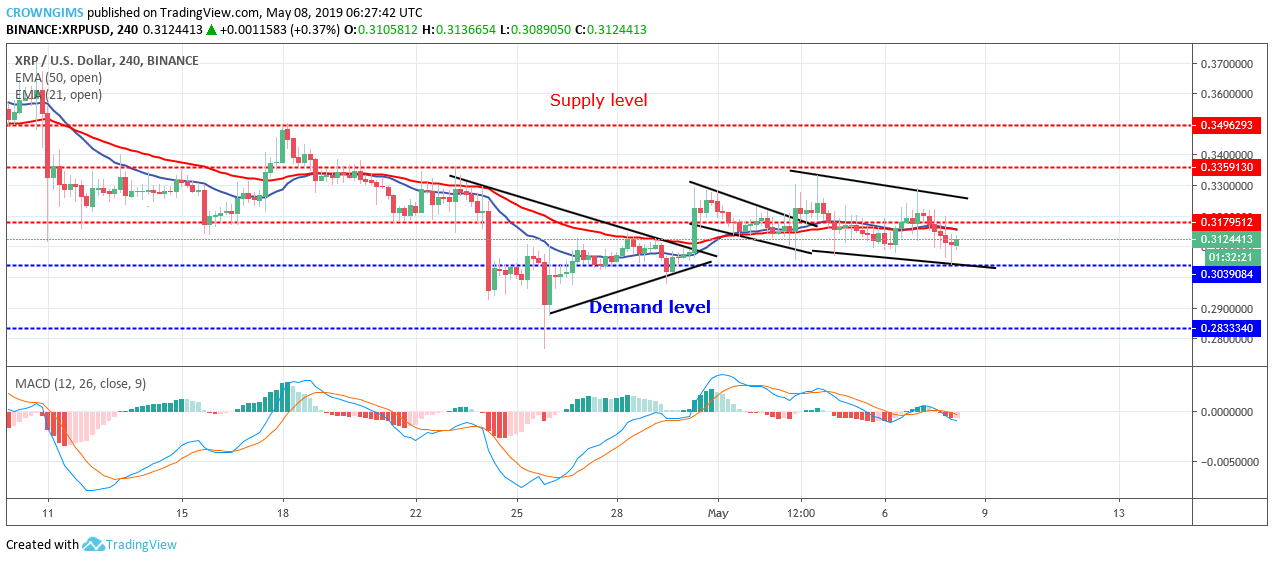

The increase in the price of XRP was opposed by the Bears and the price ranged down towards $0.30. The coin broke out of the symmetrical triangle on April 30. XRP price increased towards the demand level of $0.33.
At the moment XRP price is under bearish pressure. It is trading below the 21 periods EMA and 50 periods EMA in which the two EMAs are interlocked to each other as a sign of temporary ranging movement. The Moving Average Convergence and Divergence period 12 with its histogram are below zero levels and the signal lines pointing down to indicate sell signal.
In case the Bulls defend the demand level of $0.30, the coin may rise towards the previous high or touch the upper drawn trend line. Increase in the pressure of the Bears may break down the $0.30 level and expose $0.28 level.
XRP/USD Price Short-term Trend: Bearish
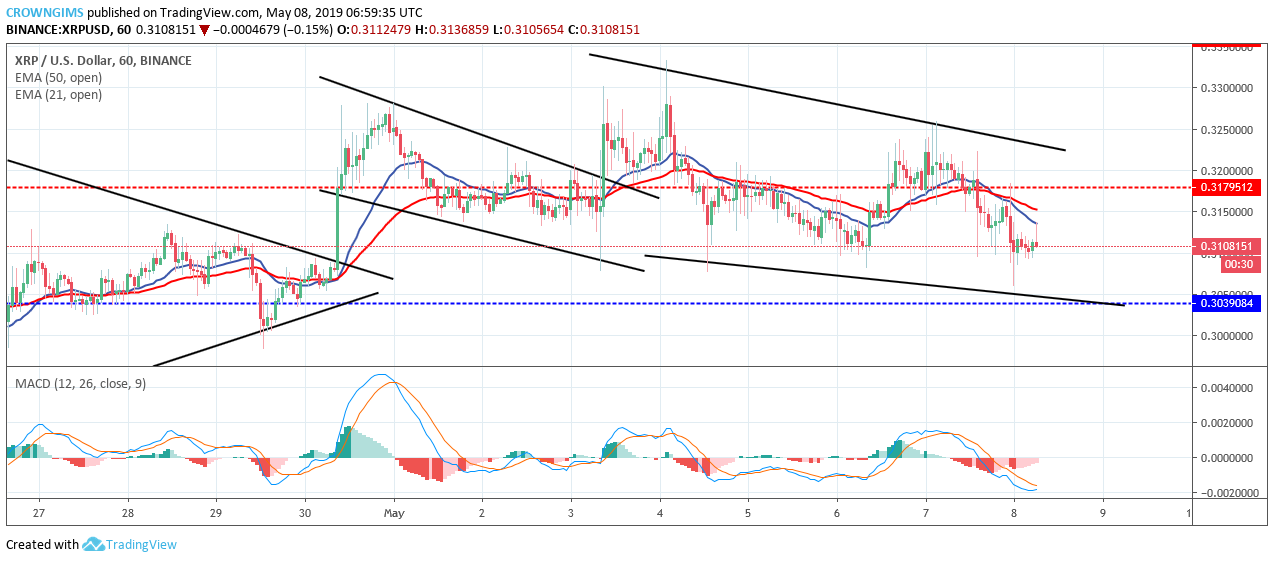
The MACD period 12 is below zero levels with the signal lines making an attempt to cross; this indicates that there may be a rise in the price of the XRP.
XRP is trading in-between and around the two EMAs. The 21 period EMA and 50 periods EMAs are interlocked to each other flat horizontally without direction indicates that consolidation is ongoing in the XRP market.
next