
Ethereum surged to $2,065 with a 9% weekly gain as whales accumulated $1 billion worth of cryptocurrency in the past week.
Ethereum ETH $1 593 24h volatility: 0.1% Market cap: $192.28 B Vol. 24h: $6.15 B is trading around $2,065, recording a 9% weekly gain, amid massive whale accumulation. In the past seven days, Ether whales have bought roughly 470,000 Ethereum, worth around $1 billion.
On-chain data from Glassnode reveals that Ethereum whales, holding between 10,000 and 100,000 ETH, have grown their holdings by around 29% in the past two weeks.
The number of addresses holding at least $100,000 worth of ETH has climbed from around 70,000 addresses on March 10 to around 75,000 at the time of writing.
Notably, Ethereum recently retested its multi-year trendline support level – a zone that has only been revisited three times since 2021: June 2022, November 2022, and now March 2025. Historically, this support level has marked the bottom before major rallies.
Popular crypto analyst Rekt Capital predicts that if ETH generates a strong reaction below $2,000, it could reclaim the $2,196–$3,900 macro range.
Ethereum has dropped into this historical demand area (light blue)
If price can generate a strong enough reaction here, then #ETH will be able to reclaim the $2196-$3900 Macro Range (black)
If ETH does this before the March Monthly Close, then this entire sub-$2200… pic.twitter.com/Fj4JYeGcBq
— Rekt Capital (@rektcapital) March 19, 2025
He added that if this recovery occurs before the March monthly close, the entire dip below $2,200 could merely be a fakeout before a stronger upside move.
ETH Price Outlook
On Ethereum’s daily chart, price recently approached the mid Bollinger Band (20-day SMA), which serves as a resistance level around $2,100. A breakout above this midline could push ETH toward the upper band near $2,230.

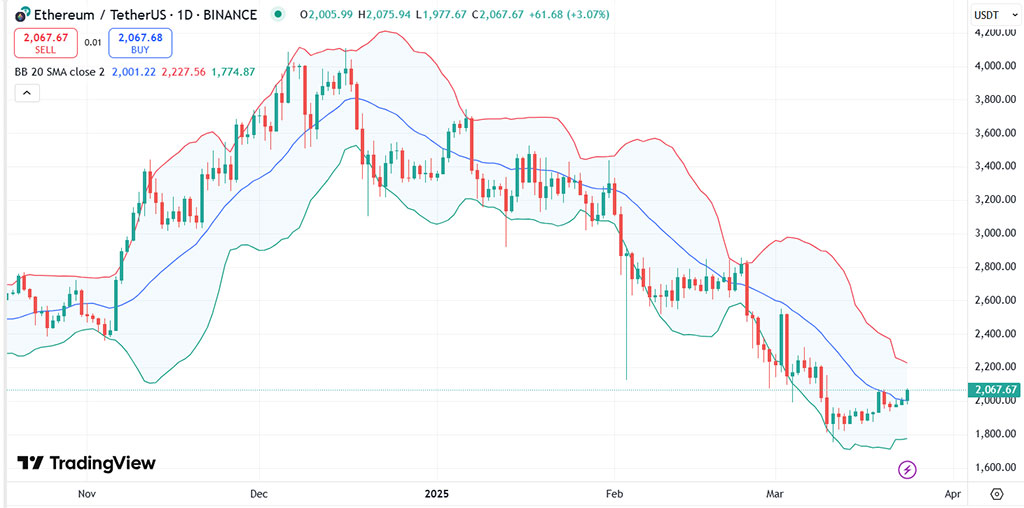
Source: TradingView
Meanwhile, the RSI has climbed to 46, rebounding from oversold territory. The upward trajectory suggests strengthening momentum.

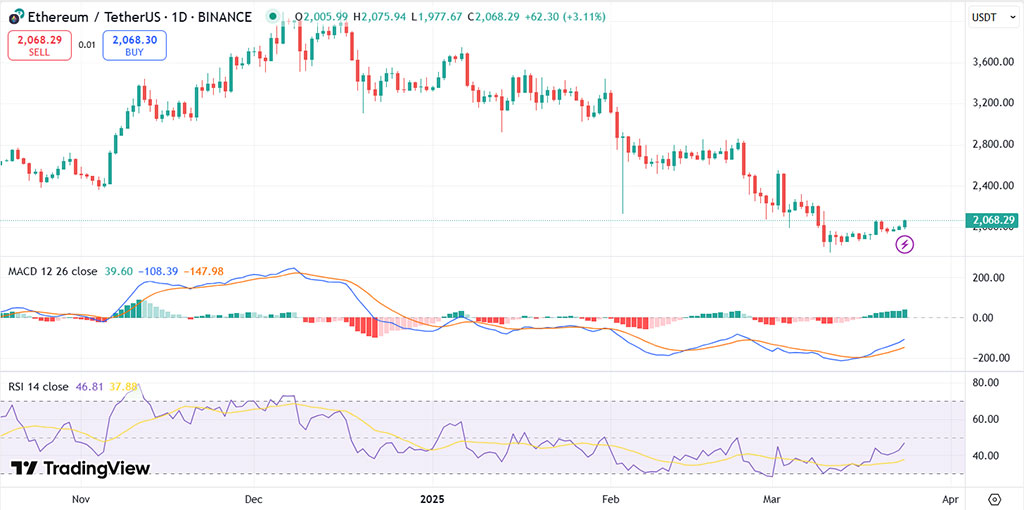
Source: TradingView
Similarly, the MACD line has crossed above the signal line, generating a bullish crossover. Moreover, the green histogram bars indicate increasing buying momentum. If the MACD sustains this motion, it could signal the start of a broader uptrend.
Interestingly, ETH appears to be forming a double-bottom pattern on the daily chart as the price recently bounced off the $1,950–$2,000 support zone twice. If it breaks above the $2,200 resistance, it could confirm the pattern and trigger a rally toward the $2,400–$2,500 range.
Investor sentiment toward Ethereum remains bullish for the long-term. Asset management giant VanEck recently forecasted a $6,000 cycle top for ETH by the end of 2025, citing increased institutional adoption.
next