
There is a probability for the price to retest the support level of $0.024 before making uptrend movement towards the resistance level of $0.031.
Key Highlights:
- There could be a pullback at $0.024;
- there is “M” pattern confirmation on the 4H chart;
- patience is required before taking Long trades.
TRX/USD Long-term Trend: Bullish
Resistance levels: $0.031, $0.041, $0.058
Support levels: $0.024, $0.015, $0.010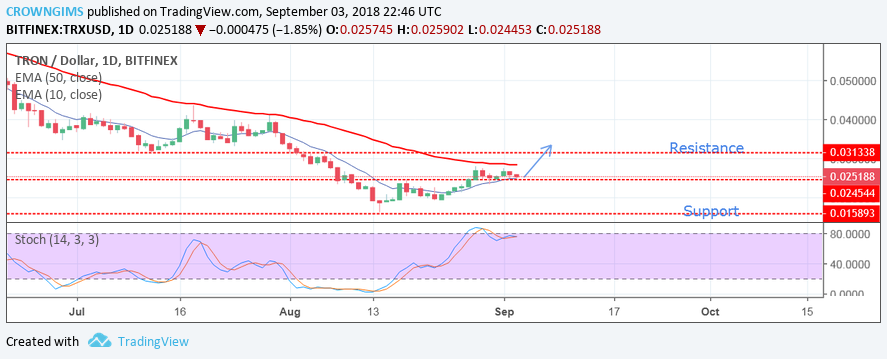

There is a strong possibility that the price might go up within the next several trading days, by making a break out towards the North at $0.031. On the daily chart the Stochastic Oscillator Period 14 is above the level 70 with the signal lines pointing towards the North, indicating that there could be a continues bullish movement.
TRX/USD Price Medium-term Trend: Bullish
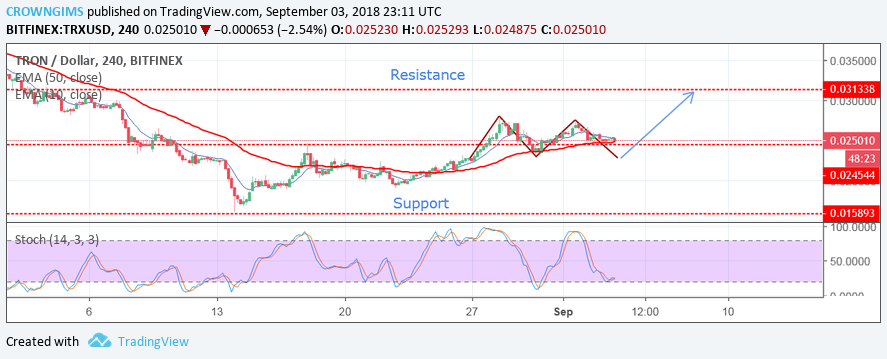
There is a probability that the price will experience uptrend movement as the Stochastic Oscillator Period 14 is at 20 (oversold level), with the signal lines directed towards the North. Patience is required before taking a long position this week.
next