
Should bears put in more pressure there is a probability for further reduction of the price towards the support level of $0.015 this week.
Key Highlights:
- Should buyers increase their momentum price will rally to the north;
- bears are in control of the market,
- in case support level of $0.05 hold, the price will increase;
TRX/USD Long-term Trend: Bearish
Resistance levels: $0.024, $0.031, $0.041
Support levels: $0.015, $0.010, $0.05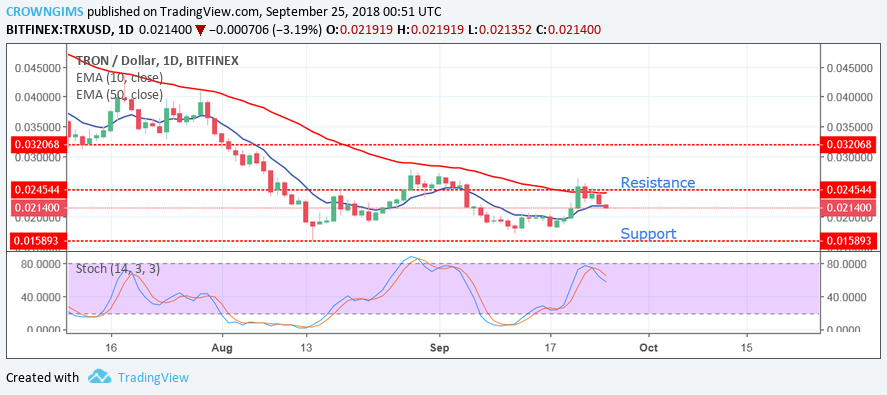

The price is below both 10-day EMA and 50-day EMA. There is a probability for further reduction of the price towards the support level of $0.015 this week. In case bears put in more pressure, the support level of $0.015 may not hold and the support level of $0.010 will be exposed.
Should the support level of $0.015 holds, the price might go up within the next several trading days, by making a break out towards the North at $0.024. The Stochastic Oscillator Period 14 on the daily chart is above level 70 with the signal lines pointing towards the south, indicating that there could be further bearish movement this week.
TRX/USD Price Medium-term Trend: Bearish
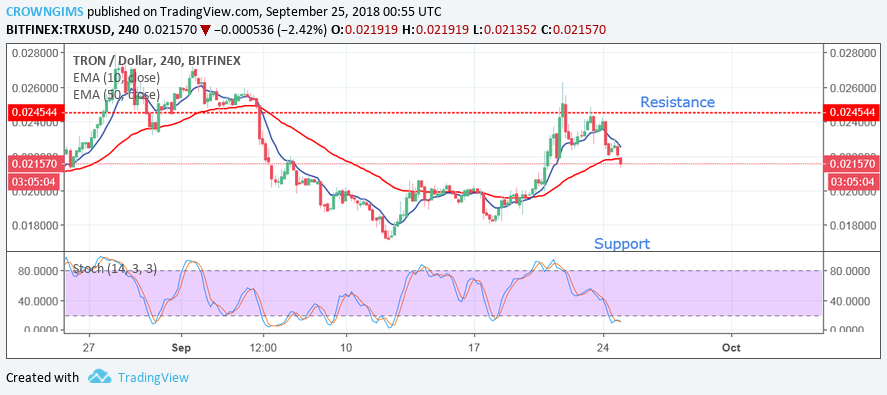
Should buyers increases their momentum this week there is a probability that the price will experience uptrend movement towards the resistance level of $0.024.Nevertheless, the Stochastic Oscillator Period 14 is above 20 level, with the signal lines directed towards the south indicate a sell signal.
next