
There is a tendency for the price to go up within the next several trading days, by making a break out towards the North at $0.024.
Key Highlights:
- There could be a bullish break out at $0.024;
- there is “W” pattern confirmation on both 4H and Daily chart;
- taking Long trades may be advisable.
TRX/USD Long-term Trend: Bearish
Resistance levels: $0.024, $0.031, $0.041
Support levels: $0.015, $0.010, $0.0050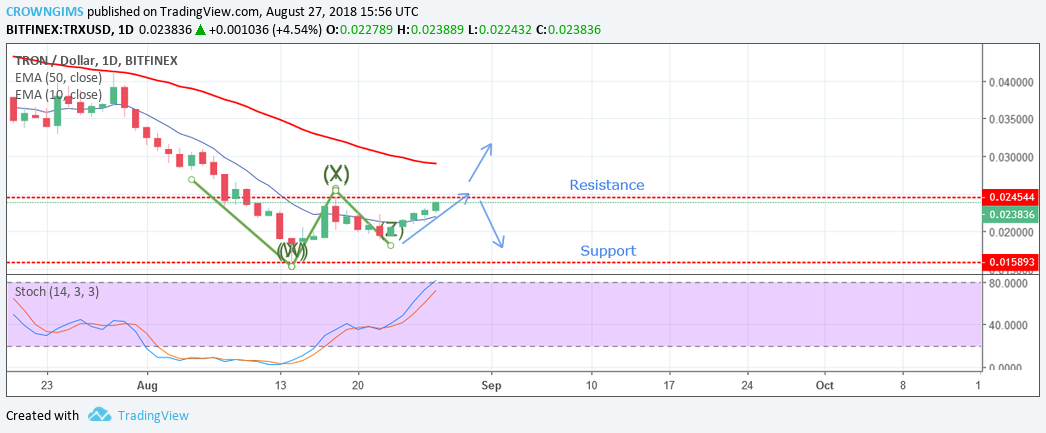

There is a probability that the price might go up within the next several trading days, by making a break out towards the north at $0.024. On the daily chart the Stochastic Oscillator Period 14 is above the level 60 with the signal lines pointing towards the North, suggesting that there could be a bullish breakout.
TRX/USD Price Medium-term Trend: Bearish
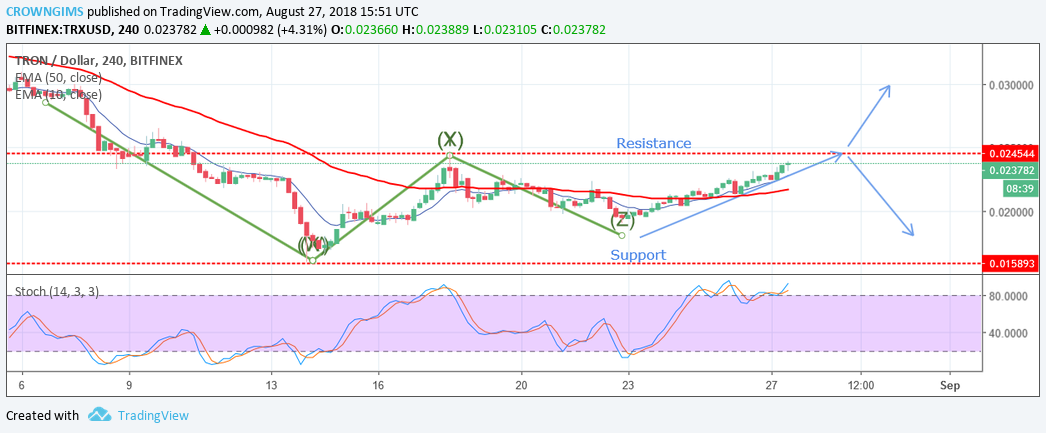
A bullish signal is in the offing when the resistance level of $0.024 is broken to the upside. Uptrend movement is possible as the Stochastic Oscillator Period 14 is above 70, with the signal lines directed towards the north. Taking long position this week may give some green pips.
next