
There is probability that the price might go down within the next several trading days, by making a break out towards the south at $0.015.
Key Highlights:
- Enough buying pressure is required for a meaningful trend reversal;
- the weakness in the market could continue;
- taking Long trades is not yet advisable.
TRX/USD Long-term Trend: Bearish
Resistance levels: $0.024, $0.031, $0.041
Support levels: $0.015, $0.010, $0.0050
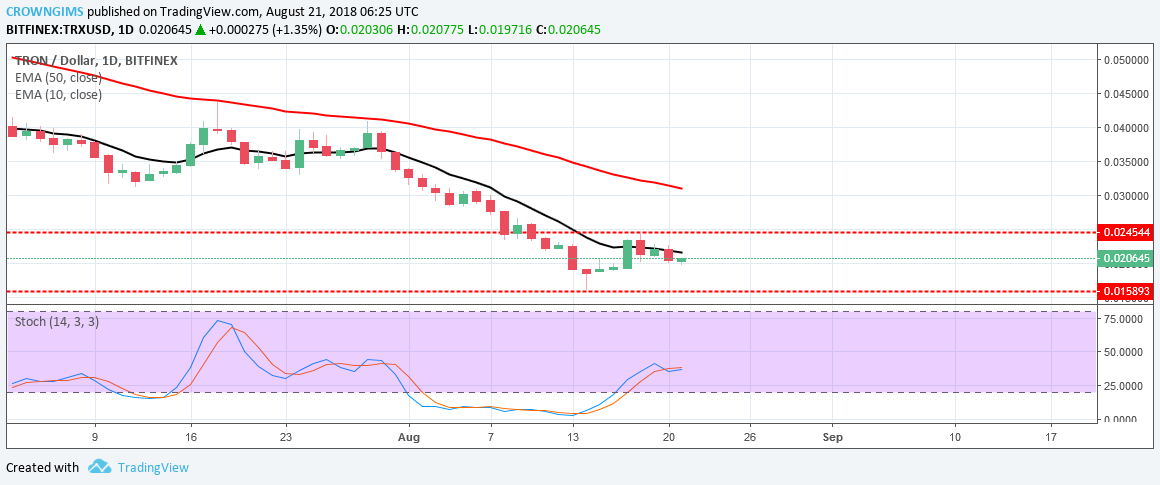

There is a probability that the price might go down within the next several trading days, by making a break out towards the South at $0.015. On the daily chart the Stochastic Oscillator Period 14 is above the level 30 with the signal lines pointing towards the south, suggesting that there could be a bearish breakout. This shows that the weakness in the market could continue.
TRX/USD Price Medium-term Trend: Bearish
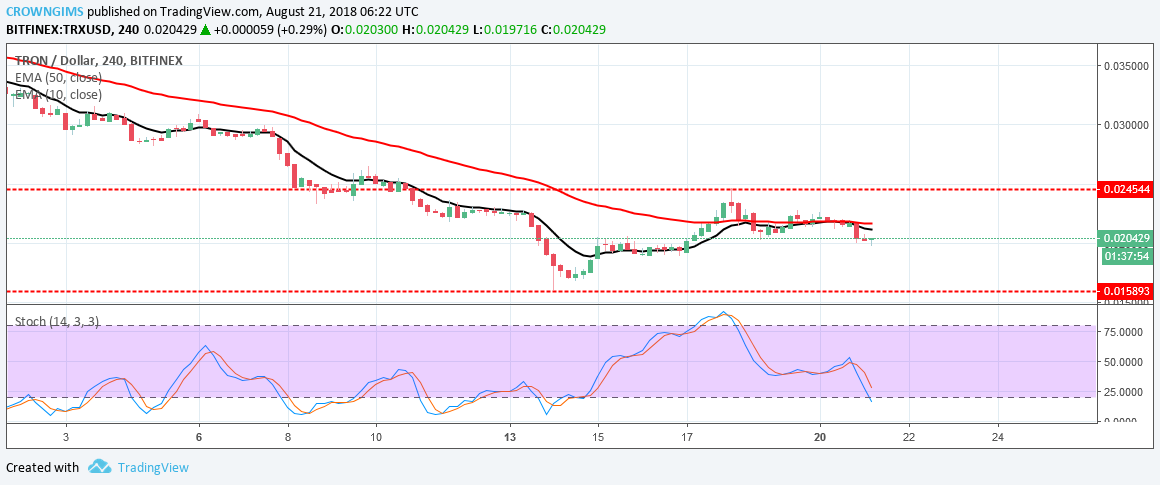
This week, the price has been ranging between the resistance level at $0.024 and the support level $0.015. A bullish signal could be triggered only when the resistance level of $0.024 is broken to the upside. That is, there is a need for enough buying pressure to be generated before a meaningful and dependable trend reversal can occur. Further southward movement is possible as the Stochastic Oscillator Period 14 is below 25, with the signal lines directed towards the south.
next