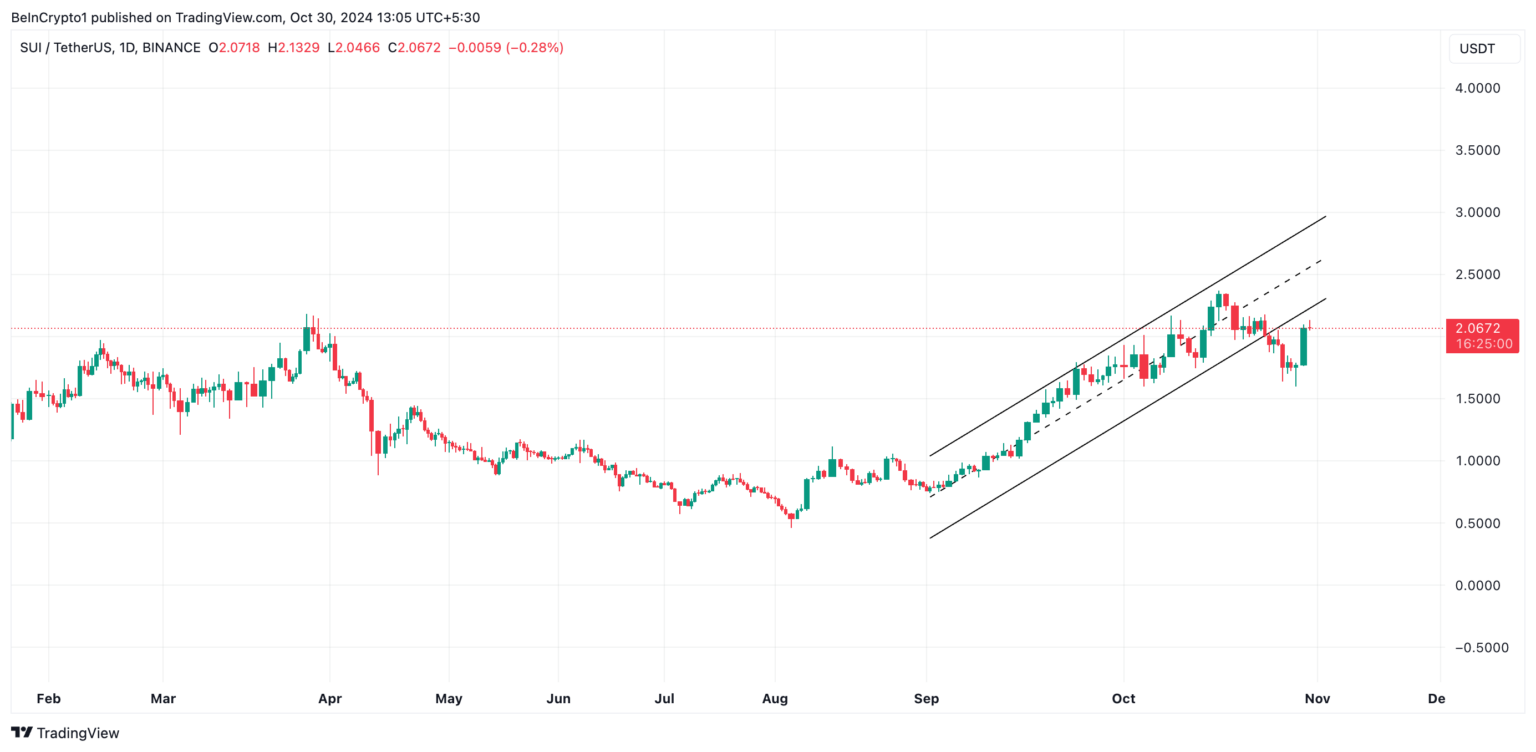
On the technical chart, SUI price is attempting to re-enter an ascending parallel channel, signaling potential recovery.
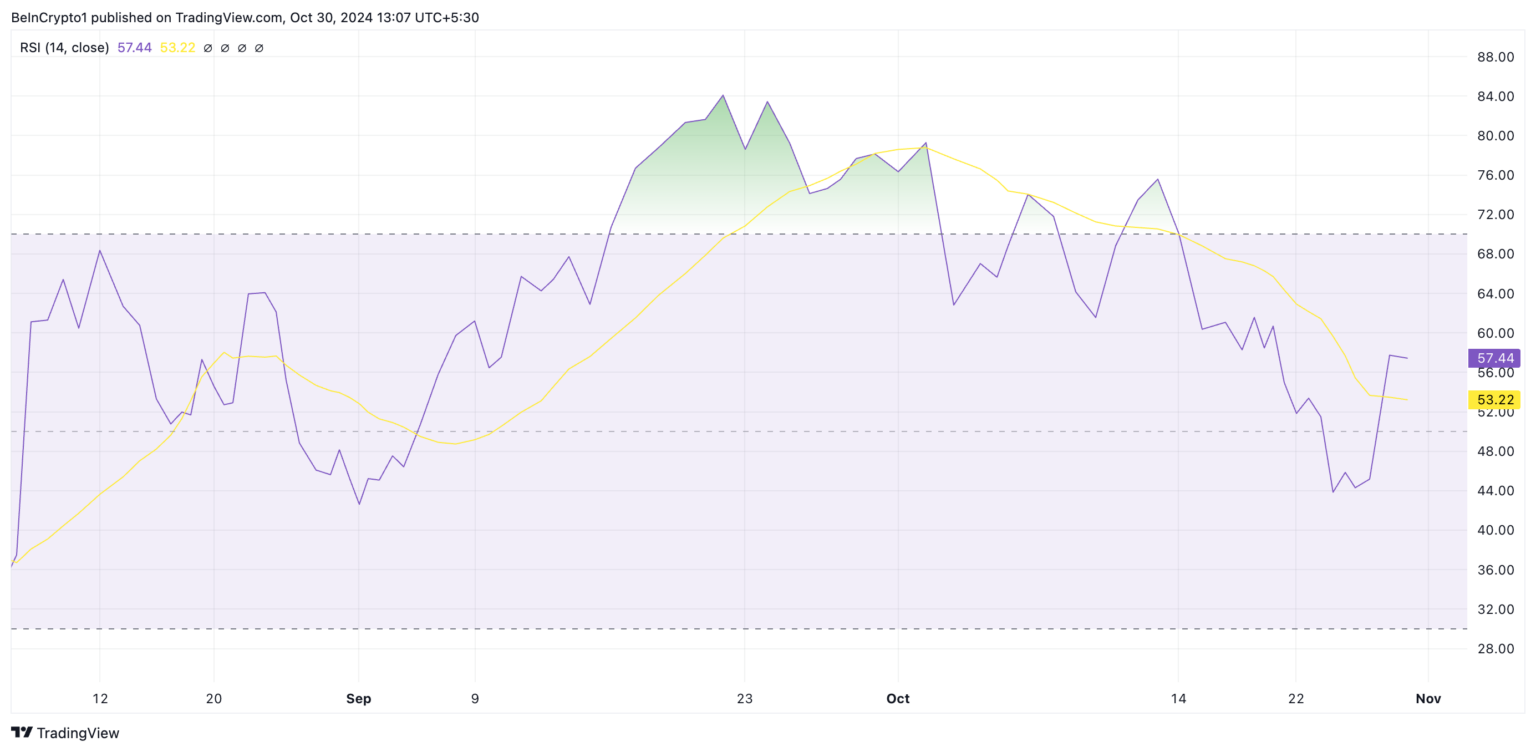
SUI’s trading volume surged by 39% over the past 24 hours, alongside an upward-trending Relative Strength Index (RSI) at 57.44.
A breakout above the critical $2.30 resistance could push SUI toward its all-time high of $2.36.
SUI SUI$3.6124h volatility:4.7%Market cap:$11.73 BVol. 24h:$3.30 B
, the native cryptocurrency of the Sui blockchain network, is now seeing renewed buying interest following the recent selling pressure in the altcoin. after hitting an all-time high of $2.36 earlier this month on October 12, SUI price faced strong selling pressure hitting the lows of $1.75 before changing its trajectory last week.
However, in the last 24 hours, SUI price gained another 10% shooting past $2.02, and is currently trading with a market cap of $5.59 billion. On the technical chart, the altcoin is showing strength once again as the SUI/USD 1-day chart for SUI price shows that it is willing to enter its ascending parallel channel, which it briefly fell below on October 22.
As shown in the below image, the upward-sloping channel gives a bullish outlook, with the SUI price oscillating between two parallel trendlines.
Courtesy: TradingView
A price drop below a channel followed by an attempt to re-enter often hints at a potential trend reversal or recovery. SUI’s possible return to the channel suggests renewed buying momentum, indicating the previous breakout may have been a bear trap.
Also, the bear trap is when the asset dips from the channel or trendline, but then quickly recovers indicating buying interest from the bulls. A bear trap is often accompanied by a spike in trading volume, signaling robust buying interest at lower levels. This seems to be the case with SUI, as its trading volume has jumped 39% in the past 24 hours, reaching $1.34 billion.
Furthermore, another metric shows that SUI’s Relative Strength Index (RSI) confirms the uptick in demand. Currently, the RSI is trending upwards at 57.44 which shows that the buying momentum is building up outweighing the selling activity.
Courtesy: TradingView
Is SUI Price Gearing for a New All-Time High?
SUI price reached an all-time high of $2.35 earlier this year while it faces critical resistance at $2.30. A successful breakout above this level and a re-entry into the channel could set SUI price on track to reclaim its October 13 all-time high of $2.36.
On the other hand, if SUI fails to break through the $2.30 resistance, this bullish outlook could be invalidated, possibly driving the price down toward the $1.64 support level.
Disclaimer: Coinspeaker is committed to providing unbiased and transparent reporting. This article aims to deliver accurate and timely information but should not be taken as financial or investment advice. Since market conditions can change rapidly, we encourage you to verify information on your own and consult with a professional before making any decisions based on this content.
Bhushan is a FinTech enthusiast and holds a good flair in understanding financial markets. His interest in economics and finance draw his attention towards the new emerging Blockchain Technology and Cryptocurrency markets. He is continuously in a learning process and keeps himself motivated by sharing his acquired knowledge. In free time he reads thriller fictions novels and sometimes explore his culinary skills.