Stellar Price Analysis: XLM/USD Trends of October 25–31, 2018

On Oct 25, 2018 at 3:36 pm UTC by · 2 mins read

Stellar price may break the demand level of $0.23, the downtrend movement will be experienced and it will be exposed to the demand level of $0.20

Key Highlights:

  • Further Downtrend movement may be experienced;
  • there is a possibility of the Stellar price bounces from the support of $0.20;
  • traders should be discipline in order to make green pips.

XLM/USD price Long-term Trend: Ranging

Supply levels: $0.26, $0.28, $0.30
Demand levels: $0.23, $0.20, $0.18XLM/USD consolidated last week in its long-term outlook. On October 11, there was a bearish run to the demand level of $0.20, bears lost the pressure and bulls interrupted further downward movement, this was confirmed with the formation of a doji bar and a massive bullish candle as the bulls made a quick return of the XLM price to north, broken the supply levels of $0.23 and $0.6.

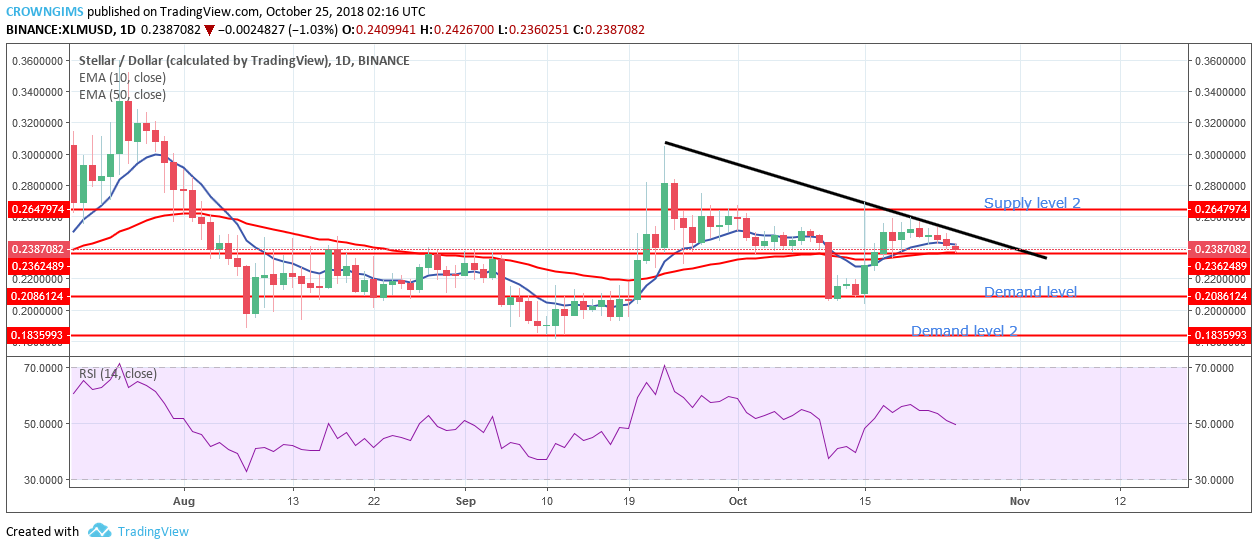
The bears equally resist the increase in XLM price by increasing their pressure and return the XLM price below the demand zone of $0.23 where the bulls now took over the market and the market increased gradually above $0.23 towards the supply zone of $0.26 and it started to consolidate.

XLM price is currently is currently on the support zone of $0.23. It is in between 50-day EMA and the 10-day EMA; it indicates a consolidation is ongoing. However, the RSI indicator is on the 50 levels with its signal lines pointing to the south which indicates selling signal and this is also supported by the opening bearish candle formed on the daily chart at the demand level of $0.23.

In case the bears increase the momentum the price would break the demand level of $0.23 and expose to the demand level of $0.20. Taking short trade is logical.

XLM/USD Price Medium-term Trend: Bearish

Stellar was bearish on the medium-term outlook last week. The pair broke the former supply zone of $0.23 upside on October 16, it headed to the supply zone of $0.26 but could not reach the target. A bearish inside bar candle was formed and the bears return the XLM price to the south towards demand zone of $0.23

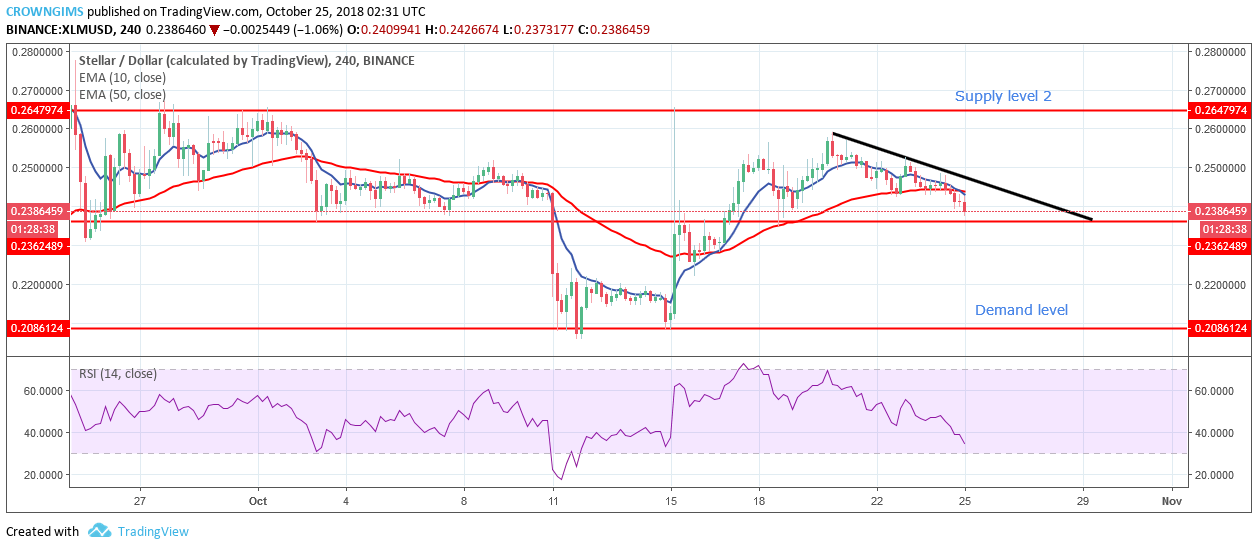
Should the demand level of $0.23 holds, XLM price will bounce and resume its uptrend movement. Stellar is below 10-day EMA and 50-day EMA, with the RSI period 14 above 20 levels with its signal lines point to the south indicates the possibility of the downtrend movement.

Share:

Related Articles

Stellar Set to Skyrocket? Rare Macro Signal Appears after 2 Years

By April 7th, 2025

Stellar (XLM), the 14th-largest digital asset, may be gearing up for a significant breakout, according to a rare macro signal that hasn’t appeared in over two years.

XLM Price Prediction: Stellar Approaches Apex of Market Correction amid Anticipated Altseason in 2025

By February 20th, 2025

The Stellar chain has gradually improved over the past years to enable seamless global payments and RWA tokenization via XLM and its strategic partnerships.

Deepseek & ChatGPT Battle It Out! Which AI Gave the Best Crypto Investment Picks?

By January 30th, 2025

This article compares their predictions to find out which AI has the upper hand in identifying winning cryptocurrencies.

Exit mobile version