
Should the bears continue with their increased momentum the Stellar price would break the demand level of $0.23 and expose to the demand level of $0.22.
Key Highlights:
- Stellar price may go south for a while;
- XLM price may bounce from the demand level of $0.23;
- traders can look for an opportunity to place a long trade.
XLM/USD Price Long-term Trend: Bullish
Supply levels: $0.26, $0.27, $0.29
Demand levels: $0.23, $0.22, $0.20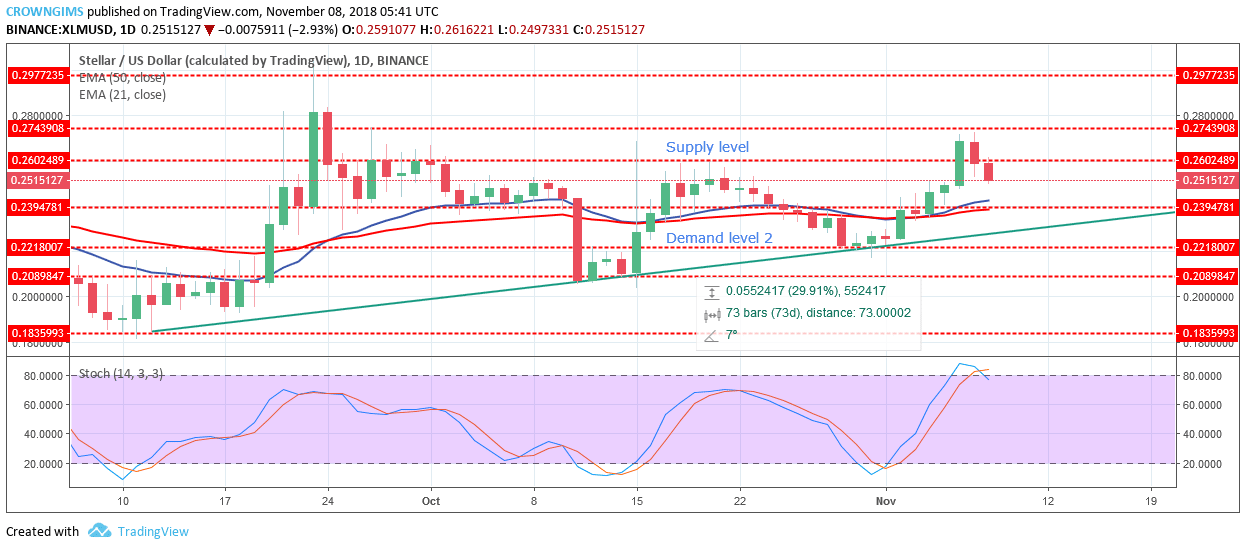

XLM price is currently trading below the supply level of $0.26 heading toward the demand level of $0.23. XLM price is above 21-day EMA and the 50-day EMA which indicates the bullish trend is ongoing. Meanwhile, the Stochastic Oscillator period 14 is above 80 levels (oversold region) with its signal lines pointing to the south which indicates a selling signal.
Should the bears continue with their increased momentum the price would break the demand level of $0.23 and expose to the demand level of $0.22. On the other hand, in case the demand zone of $0.23 hold and the XLM price bounce to the north, the trader can look for an opportunity to place buy limit order at this level so as to take long trading and place the stop loss below the demand zone of $0.23.
XLM/USD Price Medium-term Trend: Bullish
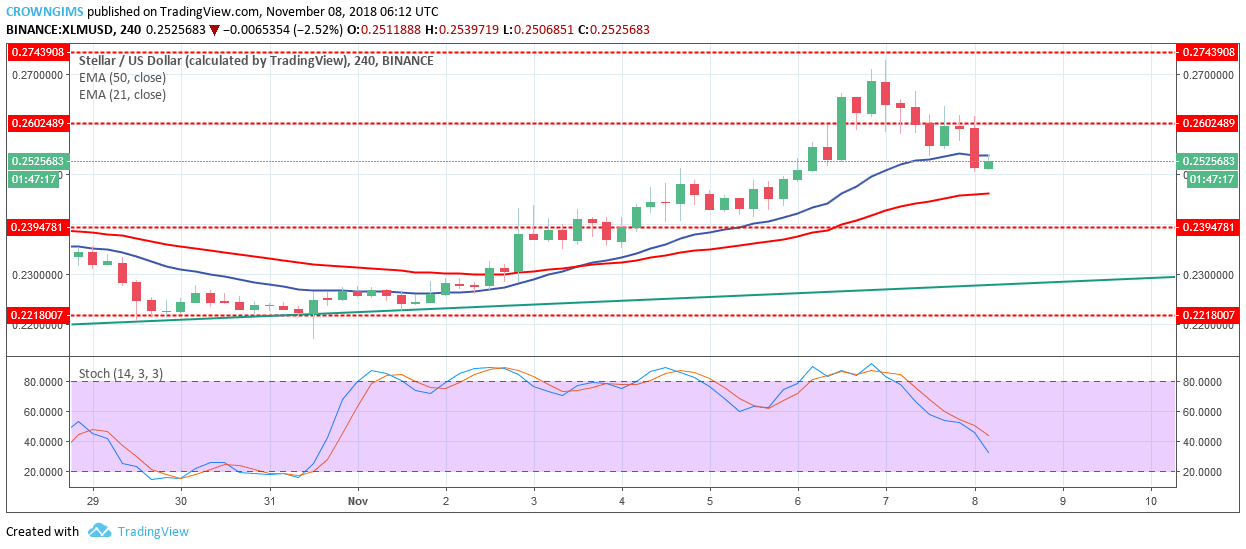
Currently, XLM price has broken downside the supply level of $0.26 exposed to demand level of $0.23. Stellar is between 21-day EMA and 50-day EMA as the sign of bearish market and the Stochastic Oscillator period 14 is at 40 levels with its signal lines point down indicates sell signal.
next