
In case the bulls gain enough momentum to break up the supply level of $0.17, Stellar will rally to the north and have its target at the $0.20 price level. Should the supply level of $0.17 holds XLM will have its low at $0.10 price level.
Key Highlights:
- Stellar price is in a downtrend;
- the bears are still in control of the XLM market;
- XLM price pulling back is inevitable.
XLM/USD price Long-term Trend: Bearish
Supply levels: $0.17, $0.20, $0.23
Demand levels: $0.13, $0.10, $0.06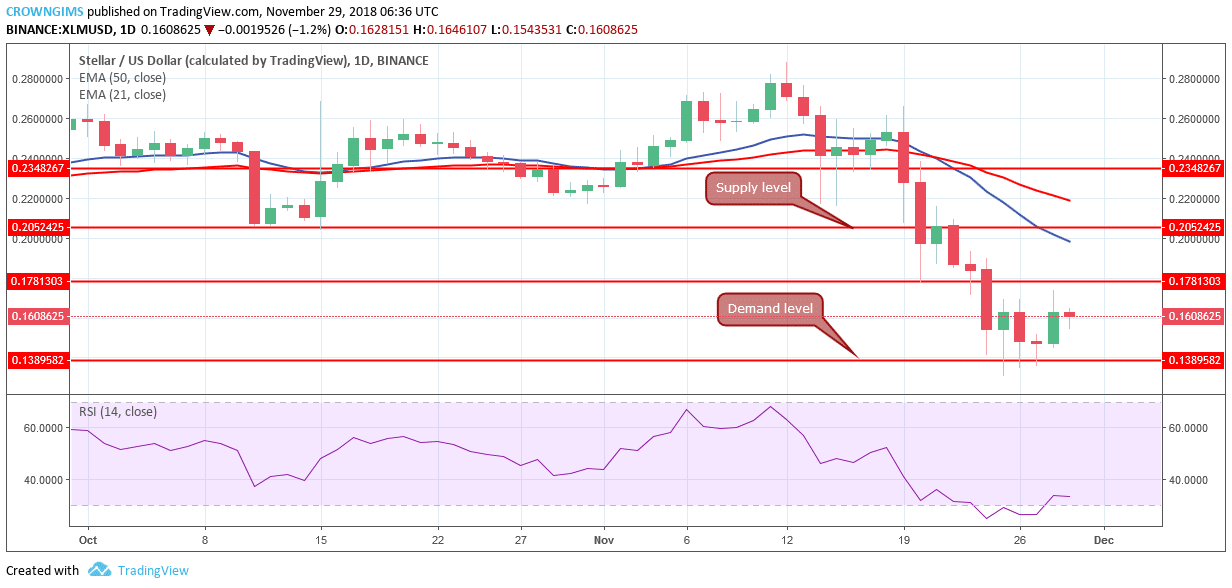

The opening market candle formed today is bullish which may be a pullback of the XLM price in order to continue its bearish trend at the demand level of $0.13. The 50-day EMA is above21-day EMA with the XLM price below the two EMAs and the price is at a distance from the EMAs indicating that bearish pressure is high in the XLM market and the XLM price may fall further. The relative strength index is above 30 levels pointing downward connotes sell signaling.
XLM/USD Price Medium-term Trend: Bearish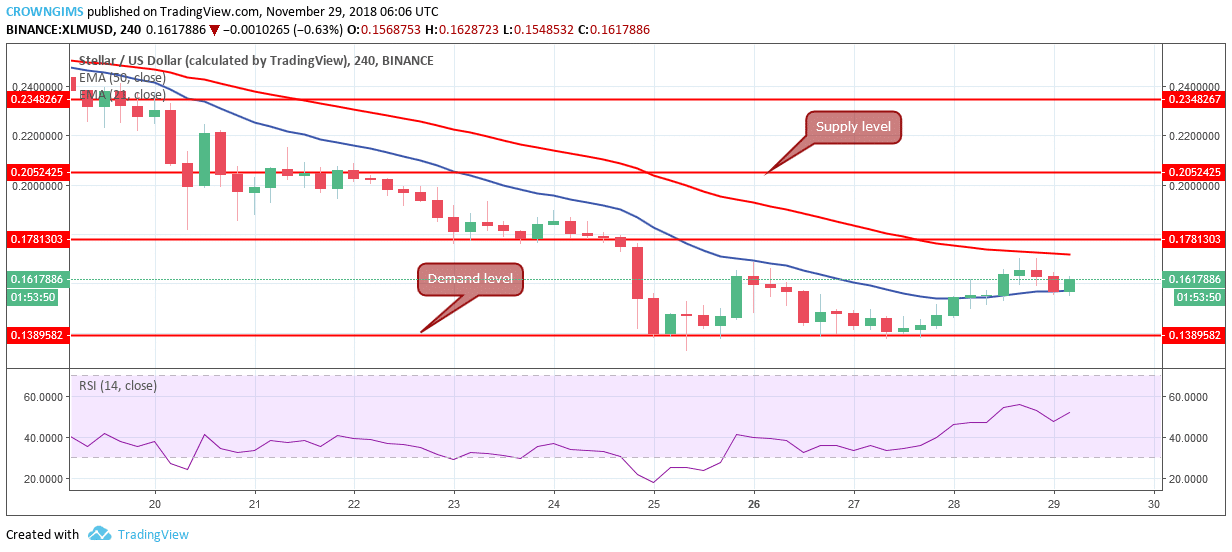

Stellar is still in its bearish trend on the 4-Hour chart. On November 25, the coin bottomed at the demand level of $0.14, it was pushed up but resisted by the 21-day EMA dynamic resistance and the price was returned to the previous low.
Yesterday, the coin broke upside the 21-day EMA and moved towards 50-day EMA which was resisted and the price remains between the two EMAs and the relative strength index is above 50-level pointing to the north which indicates buy signal and that the bulls are gaining momentum gradually.
In case the bulls gain enough momentum to break up the supply level of $0.17, Stellar will rally to the north and have its target at the $0.20 price level. Should the supply level of $0.17 holds XLM will have its low at $0.10 price level.
next