
Continuation of the bears’ pressure will lead to the penetration of the demand level of $0.10 in which the previous low ($0.09 price level) will be the target of Stellar price. Only when the $0.10 price level hold that will make the coin rally to the north.
Key Highlights:
- Stellar price broke out of sideways movement;
- the coin is trading below the two EMAs;
- the bears are in control of the XLM market.
XLM/USD price Long-term Trend: Bearish
Supply levels: $0.12, $0.13, $0.15
Demand levels: $0.10, $0.09 $0.06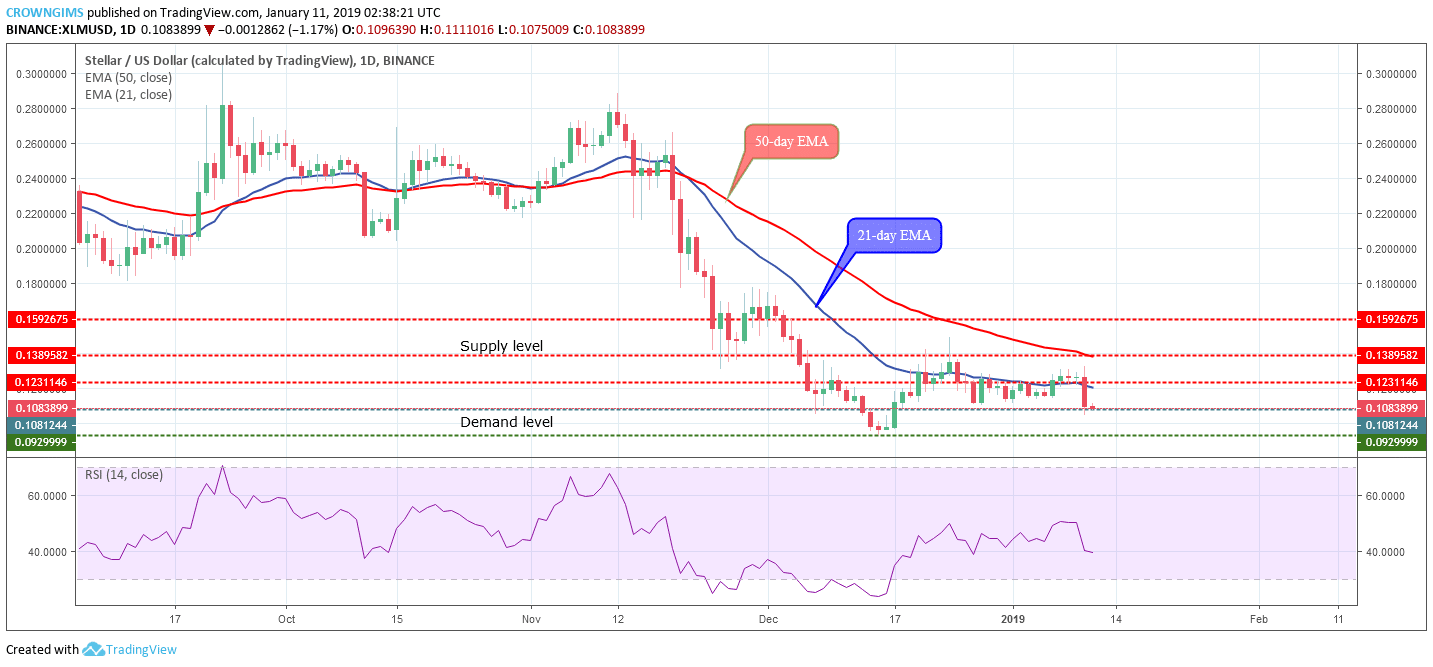

Continuation of the bears’ pressure will lead to the penetration of the demand level of $0.10 in which the previous low ($0.09 price level) will be the target of XLM price. Only when the $0.10 price level hold that will make the coin rally to the north. Stellar price is currently trading below the 21-day EMA and 50-day EMA with the two EMAs bending down which indicates the bearish pressure in the XLM market. Meanwhile, the Relative Strength Index is at 40 levels and its signal line pointing down which connotes sell signal.
XLM/USD Price Medium-term Trend: Bearish
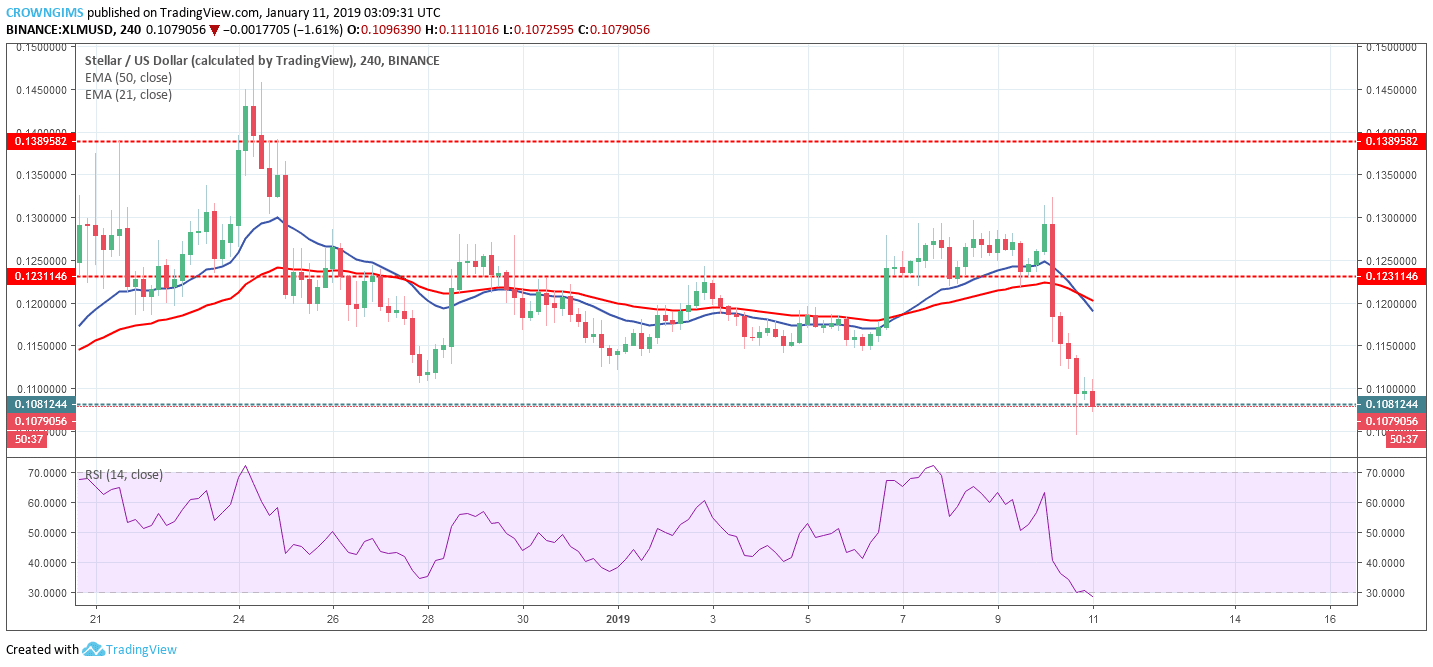
The 21-day EMA has crossed the 50-day EMA downside as evidence of a bearish trend and the XLM price is trading below the two EMAs. More bearish candles are emerging and the coin has penetrated the demand level of $0.10 exposing the demand level of $0.09. The Relative Strength Index period 14 is below 30 levels pointing down indicates further declination of XLM price (sell signal).
next