
A close of a big bullish candle above the $0.12 or a clear penetration of a bearish candle below it is expected, should there be a breach below $0.10, wait for the Stellar pullback and place sell position with taking profit at $0.09.
Key Highlights:
- Ranging movement is ongoing in the Stellar market;
- the coin is trading below the two EMAs;
- the bulls may take over the market.
XLM/USD price Long-term Trend: Ranging
Supply levels: $0.12, $0.13, $0.15
Demand levels: $0.10, $0.09 $0.06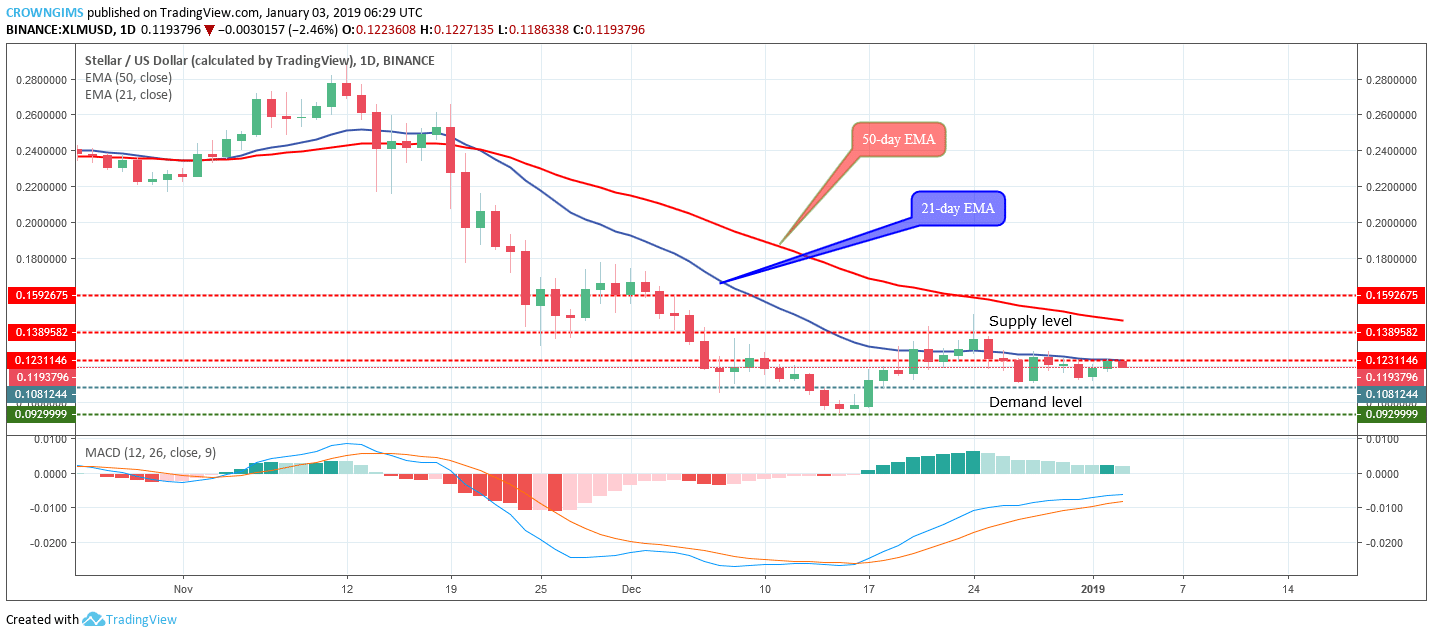

The coin was formerly trading on the 21-day EMA, that is between the two EMAs but now it has moved to trade below the two EMAs. The MACD period 12 with its histogram is above the zero levels and the signal lines pointing upward below zero levels indicates that the coin may likely break up the upper range level. In case the lower level of the range is broken downside by the bears, $0.09 may be its target.
XLM/USD Price Medium-term Trend: Ranging
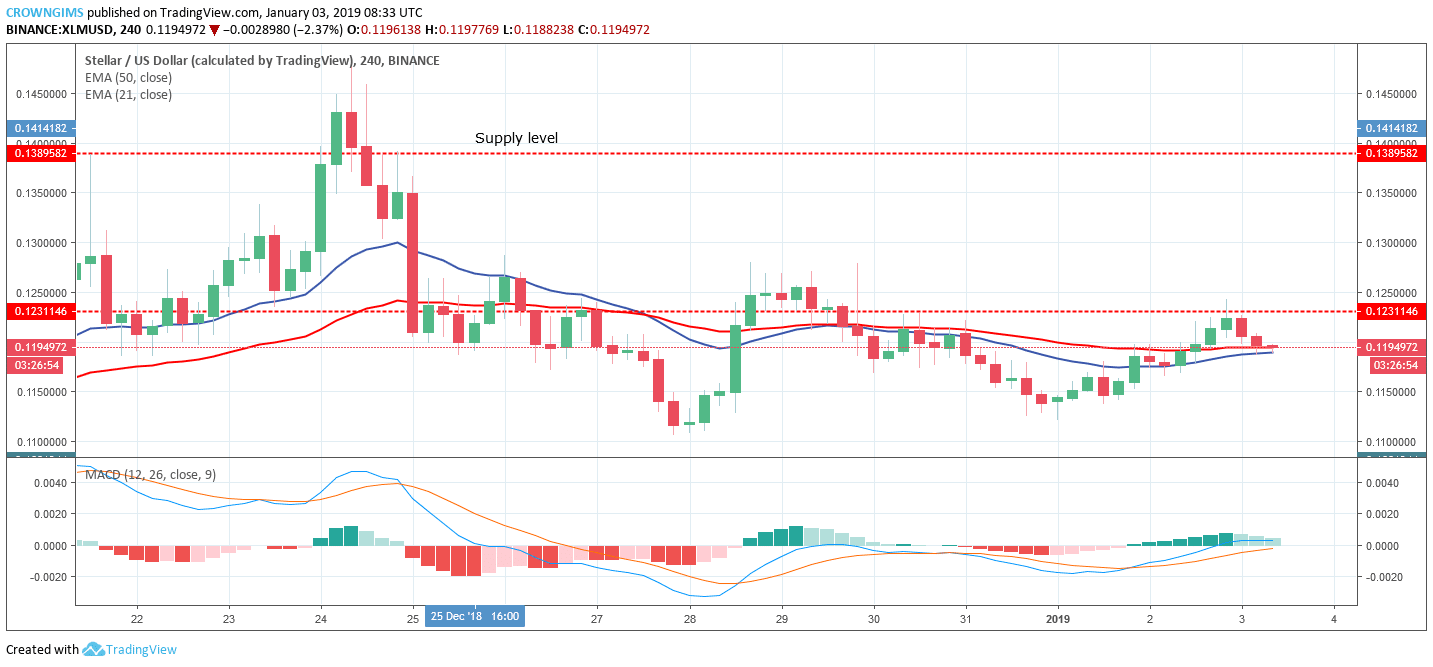

Stellar is in a sideways movement on the medium-term outlook. The bulls could not sustain its momentum after reaching the high of $0.14. The bears took over the market and the coin was pushed down and found its support at $0.10; the coin continues moving sideways within the range of $0.12 and $0.10 for days.
A close of a big bullish candle above the $0.12 or a clear penetration of a bearish candle below it is expected. In case the coin closes above $0.12 supply level, wait for a correction to buy and take your profit at $0.13 with your stop loss at $0.10, but should there be a breach below $0.10, wait for the pullback and place sell position with taking profit at $0.09.
The two EMAs are interwoven with the Stellar price moving around and over the two EMAs which indicates ranging movement is ongoing. The MACD is above the zero levels with the signal lines point up indicates buy.
next