SOL price drops to $140, the level last seen in October 2024.
Over the past month, SOL has lost 38% of its value and 40% of its market cap.
On-chain data shows rising selling pressure, with a sharp decline in Solana's transfer and DEX volumes.
SOL price SOL$138.424h volatility:3.3%Market cap:$71.47 BVol. 24h:$2.83 B
continues its ongoing decline, falling to $140 on February 26, a level last seen in October 2024. While the token has staged a minor recovery of around 4.5% in the past 24 hours, it remains down 17% since February 22.
Over the past month, SOL has shed nearly 38% of its value, raising concerns of an extended downtrend. During the same time, the token experienced a 40% drop in its market cap, currently sitting at $70.6 billion.
On-chain data suggests investors are in a state of “fear”, with the net unrealized profit/loss indicator pointing to increased selling pressure. Crypto analyst Ali Martinez noted a sharp decline in Solana’s transfer volume — from $1.99 billion in November 2024 to just $14.57 million at press time. Additionally, decentralized exchange (DEX) volumes on Solana have fallen by 30% over the past week, marking their lowest level since October 2024.
Data from CoinGlass shows that SOL Futures Open Interest has plummeted from $8.57 billion on January 19 to $4.41 billion on February 26. This sharp decline reflects reduced trader confidence.
Many analysts attribute this downward momentum to the fading hype around memecoins after the LIBRA pump-and-dump scheme. Glassnode data suggests that capital inflows into Solana-based tokens recently turned negative, suggesting a lack of fresh liquidity.
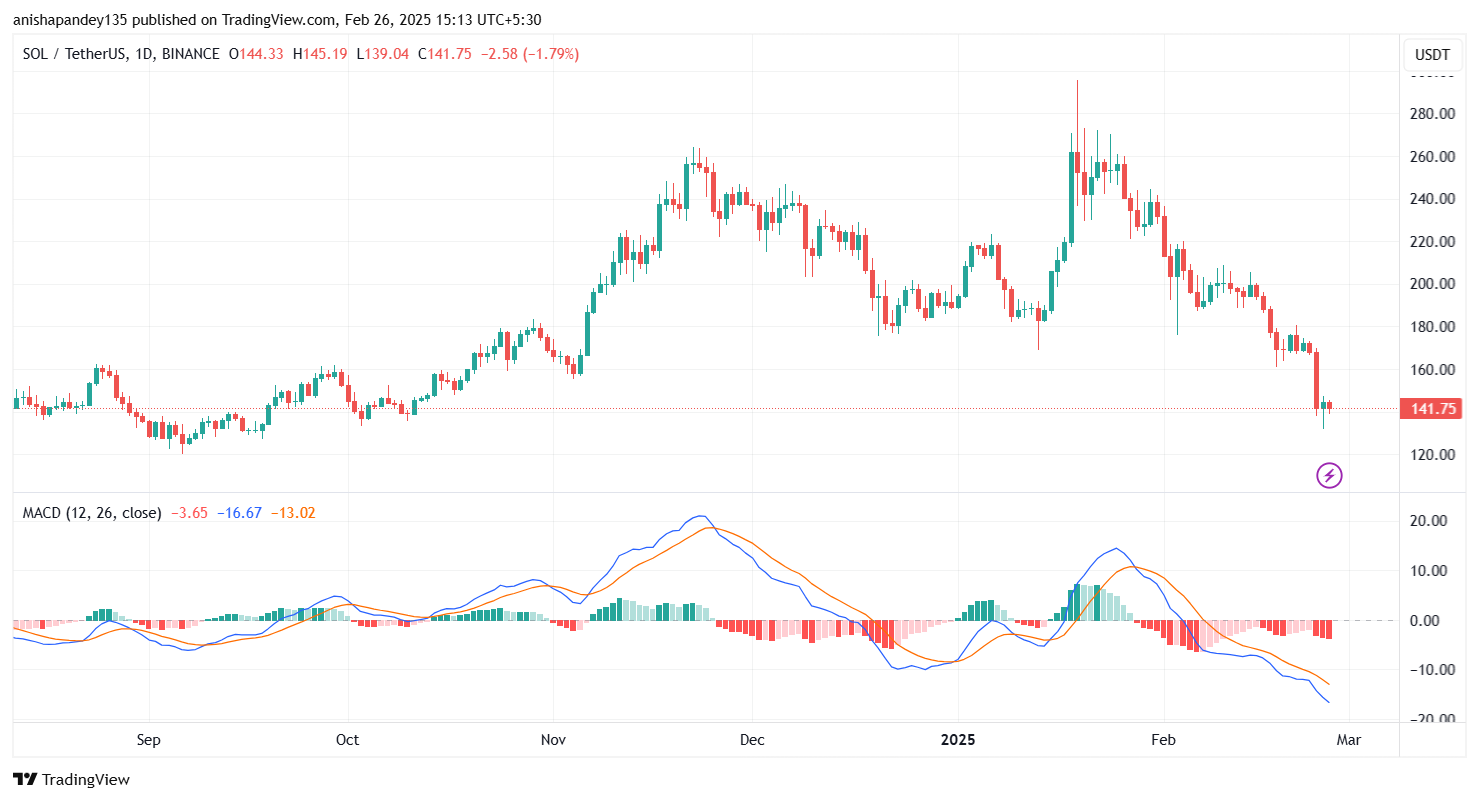
SOL Price Trajectory
On the daily SOL price chart, the Moving Average Convergence Divergence (MACD) indicator shows a deepening bearish crossover. The histogram continues to print red bars, signaling increasing downward momentum. Such MACD formations generally lead to prolonged selloffs unless a strong bullish catalyst emerges.
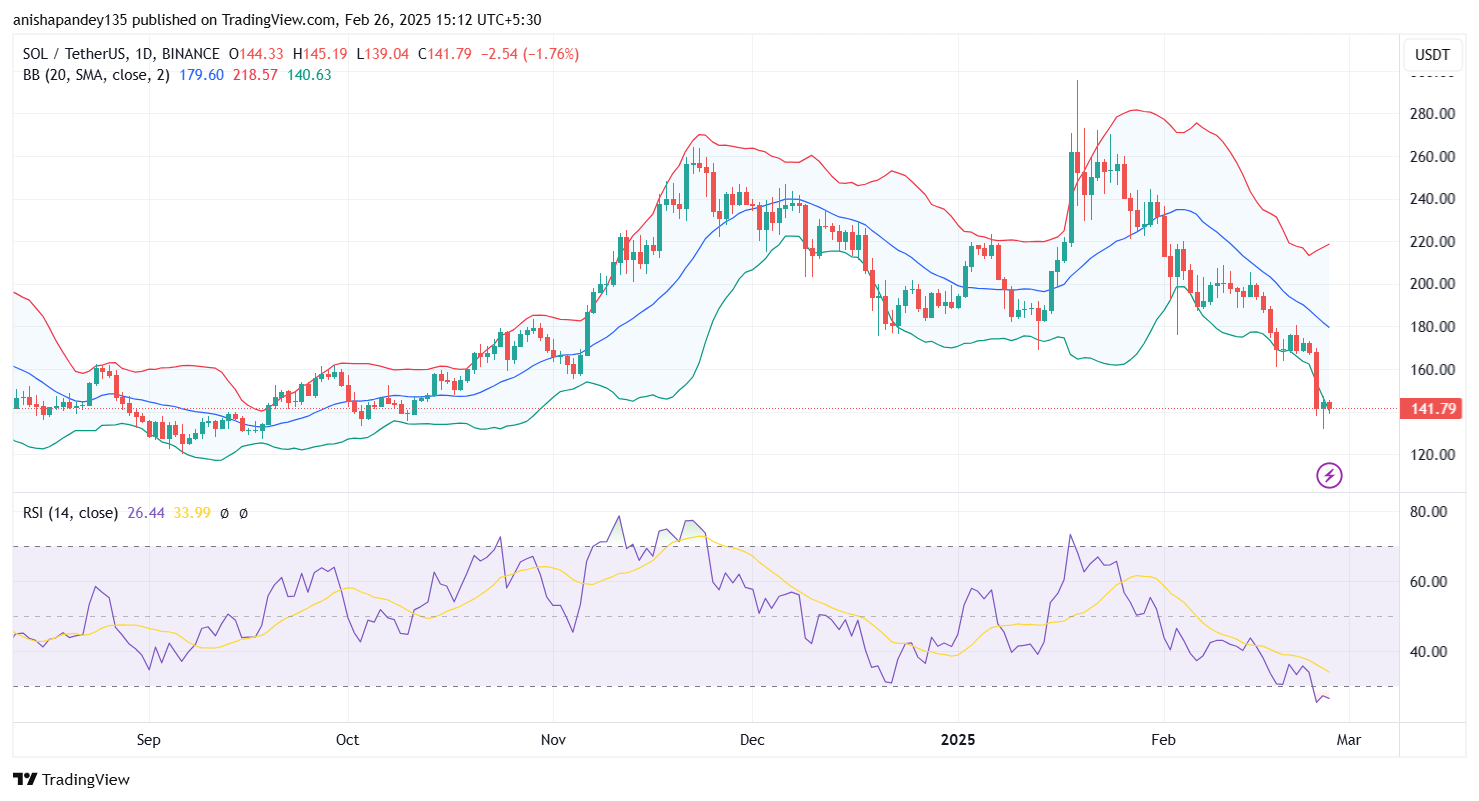
On the other hand, the Relative Strength Index (RSI), sitting in oversold territory, suggests that selling pressure has reached extreme levels. This could lead to a short-term relief rally. However, traders should be cautious as RSI can remain oversold for extended periods during strong downtrends.
Meanwhile, SOL price is currently hugging the lower Bollinger Band ($140.63), indicating that it is trading at an extreme deviation from its 20-day simple moving average ($179.60). This suggests the possibility of further downside unless a reversal pattern forms. If SOL manages to reclaim the mid-band as support, traders could see a bounce toward $160–$170.
Otherwise, SOL may struggle to reclaim lost ground in the short-term without a major bullish catalyst and rise in buying volumes. A drop to $120 is still possible, according to analysts.
Disclaimer: Coinspeaker is committed to providing unbiased and transparent reporting. This article aims to deliver accurate and timely information but should not be taken as financial or investment advice. Since market conditions can change rapidly, we encourage you to verify information on your own and consult with a professional before making any decisions based on this content.
With a background in finance and a passion for innovation, Anisha has been covering the ever-evolving world of crypto for over four years. Her deep understanding of the crypto market have made her a trusted source for analysis and news. Whether it's dissecting the latest trends or decoding whitepapers, Anisha is dedicated to bringing clarity to the world of digital assets.