
For Monero price to break out from this bound range zone, a radical fundamental event is needed; there is a probability that the coin will break the accumulation territory of $97 downside and the coin may have the low accumulation territory $86 as its target.
Key Highlights:
- Monero may break $97 price level downside;
- XMR price may increase above $111 this week;
- ranging is ongoing.
XMR/USD Price Long-term Trend: Ranging
Distribution Territories: $111, $119, $126,
Accumulation Territories: $97, $86, $76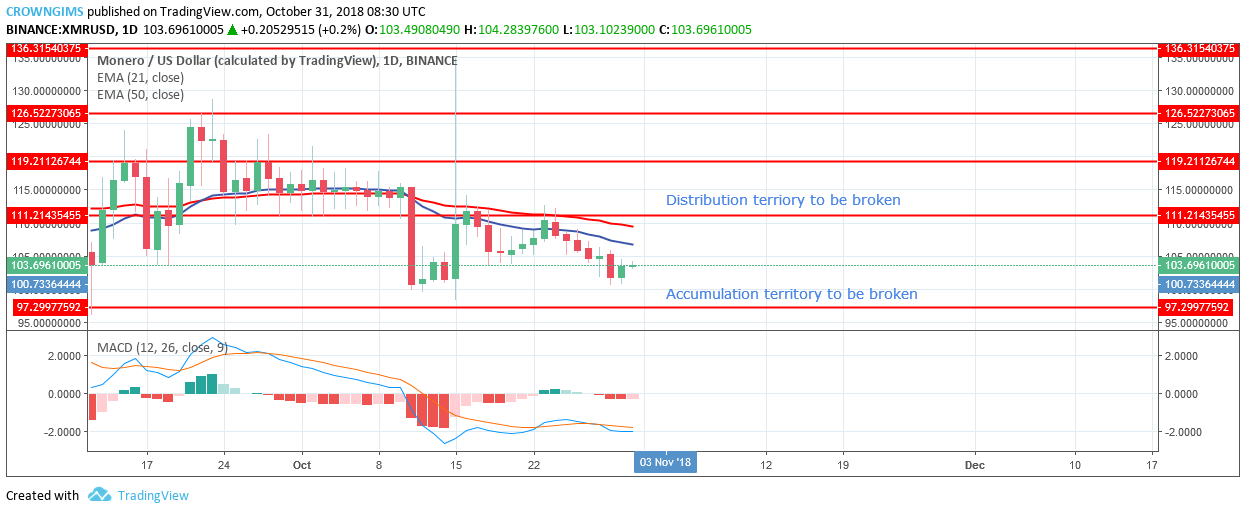

On October 23, the bulls made an attempt to break out the distribution territory of $111 upside but the bears prevented it by forming bearish candles that brought down the XMR price to $97 accumulation area. XMR price was bearish within the bound range last week.
Currently, XMR price is above the accumulation territory of $97. For XMR price to break out from this bound range zone, a radical fundamental event is needed. XMR price is below the 21-day EMA and 50-day EMA with the two EMAs fan apart and MACD with its histogram below zero level and the signal lines parallel without showing direction indicates ranging within the channel is ongoing.
There is a probability that the coin will break the accumulation territory of $97 downside and the coin may have the low accumulation territory of $86 as its target.
XMR/USD Price Medium-term Trend: Bearish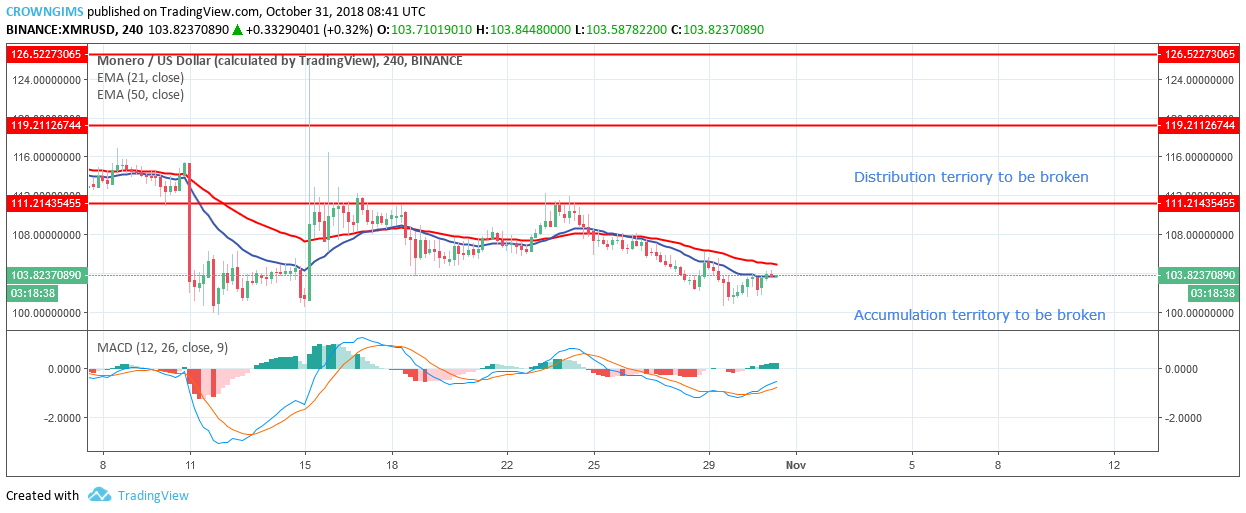
XMR is in bearish trend in its short-term outlook. XMR price continues falling within the bound range of distribution territory of $111 and accumulation territory of $97. In case the distribution territory of $111 hold and the bears increase their pressure, the accumulation territory of $97 will be broken and the coin will be exposed to the $86 price level.
The 21-day EMA crossed 50-day EMA downside which connotes downtrend. XMR price is on 21-day EMA while 50-day EMA is above the 21-day EMA which indicates that there is a probability for the bulls to take over and upward movement may occur this week should the bulls increase their momentum. MACD with its histogram and its signal lines are above the zero level with the signal lines point to the north indicate buy signal.
next