This purchase brings its total Bitcoin holdings to 506,137 BTC, acquired for approximately $33.7 billion at an average price of $66,608 per BTC. As a result, the firm now holds over 2% of Bitcoin’s total supply.
The milestone has had a positive impact on the company’s stock (MSTR), which has rebounded alongside Bitcoin’s price. Nasdaq data shows that MSTR stock rose over 4% in pre-market trading, now priced around $318.
The stock has also reclaimed the $300 level, marking a nearly 5% year-to-date (YTD) increase.
It is important to note that Strategy is planning to raise up to $21 billion to further accelerate its Bitcoin treasury strategy.
Network Activity and Rising Transaction Fees
Ali Martinez, a popular crypto analyst, pointed out that Bitcoin transaction fees have nearly tripled over the past week.
This increase in fees indicates heightened network activity, usually driven by increased on-chain transactions and demand for block space.
— Michael Saylor ⚡ Founder of MicroStrategy (Parody) (@Saylorsatsire) March 24, 2025
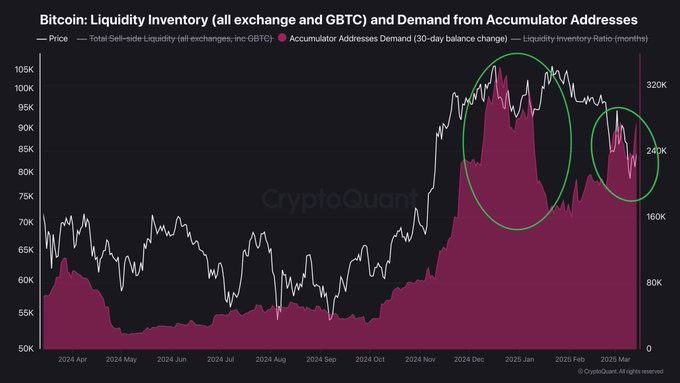
The latest liquidity inventory chart from CryptoQuant supports this observation, showing a sharp increase in accumulator addresses’ demand.
Source: CryptoQuant
When large investors (whales) absorb liquidity, supply on exchanges diminishes, reducing selling pressure and potentially pushing prices higher.
The accumulation suggests that BTC’s upward momentum could continue in the near term.
Bitcoin Price Analysis
Despite the overall bullish outlook, Martinez also warned that Bitcoin may be approaching a short-term top.
The TD Sequential indicator, a tool used to time market trends, suggests that Bitcoin could face profit-taking pressure soon. If traders follow this signal, Bitcoin may see a temporary pullback before resuming its upward trajectory.
After timing the recent bottom, the TD Sequential indicator now suggests #Bitcoin$BTC may be approaching a short-term top, hinting at potential profit-taking ahead. pic.twitter.com/3NZOsKfXr1
As of now, Bitcoin trades at $87,704.05, up 3.11% in the past 24 hours. Trading volume has increased by 129.64%, indicating strong market interest, shows CoinMarketCap data.
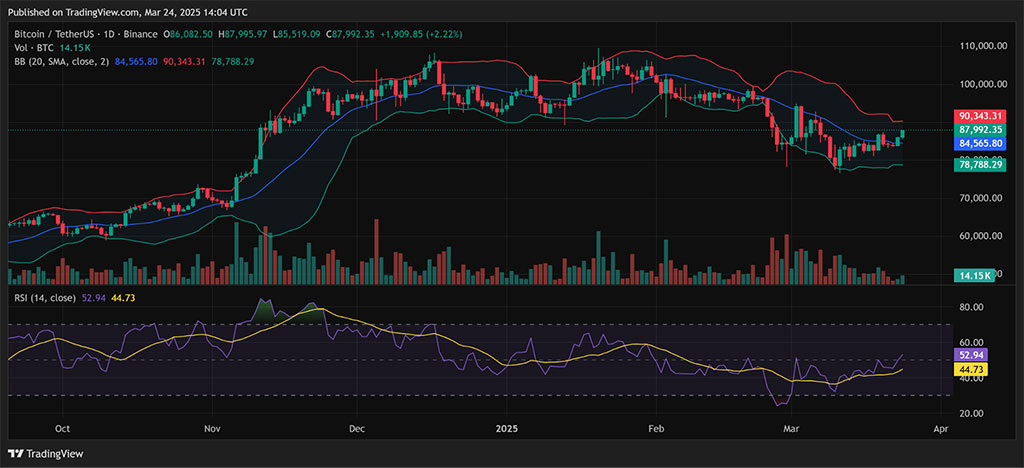
To assess Bitcoin’s future price trajectory, key technical indicators such as the Relative Strength Index (RSI) and Bollinger Bands (BB) provide further insights.
The Relative Strength Index (RSI) reads a value above 52, which means that the bulls are attempting to take over. The gradient of the line suggests a surge in demand.
Source: TradingView
The Bollinger Bands indicate that Bitcoin’s price is nearing the upper Bollinger Band, a resistance level at $90,343. A break above the upper Band could indicate continued bullish momentum.
However, a rejection could lead to a pullback towards the middle Band at $84,565 and the lower Band at $78,788.
Disclaimer: Coinspeaker is committed to providing unbiased and transparent reporting. This article aims to deliver accurate and timely information but should not be taken as financial or investment advice. Since market conditions can change rapidly, we encourage you to verify information on your own and consult with a professional before making any decisions based on this content.
A crypto journalist with over 5 years of experience in the industry, Parth has worked with major media outlets in the crypto and finance world, gathering experience and expertise in the space after surviving bear and bull markets over the years. Parth is also an author of 4 self-published books.