Mantra (OM) Defies Market Meltdown: Can It Break Past $10?
The crypto market downfall results in a minor pullback in Mantra (OM) price. As the breakout run continues the higher low trend, the rising network activity hints at an extended rally. Will the underlying support drive the OM price to $10?
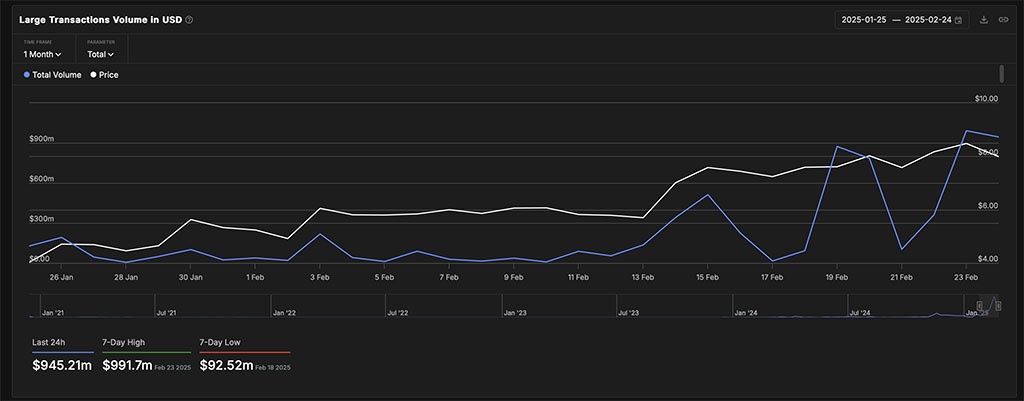
Transaction volume over Mantra jumps from $128.3M to a 30-day high of $991.7M.
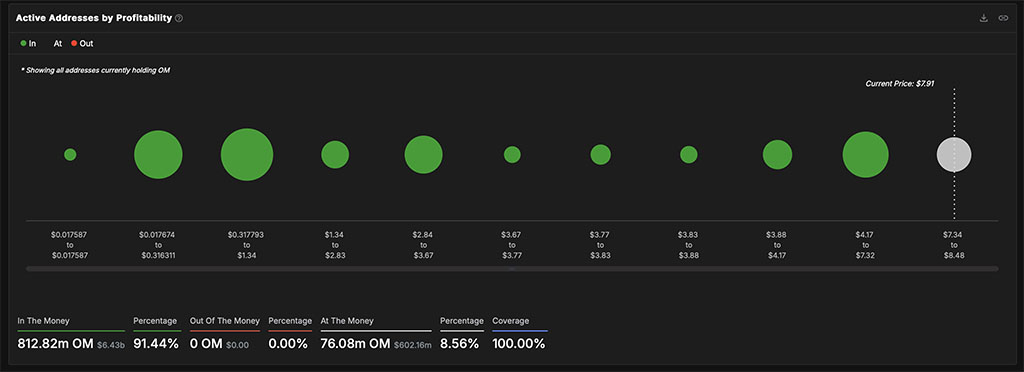
On-chain volume nears $1B, 91.44% of OM supply still in profit.
Mantra targets $10.51, with 1.272 Fibonacci extension pointing to $14.32.
With a massive crash in the crypto market, liquidations in the past 24 hours have reached $1.51 billion. Despite the increasing selling pressure over altcoins, Mantra OM$0.2124h volatility:4.7%Market cap:$204.92 MVol. 24h:$26.61 M
stands its bullish ground.
Amid the downfall, the total crypto market cap has fallen to $2.86 trillion. Will this bullish sustenance drive Mantra beyond the $10 psychological milestone?
From $3.50 to $9.11: Mantra’s Meteoric Rise
In the daily chart, the Mantra price action showcases a bullish trend with a flag pattern breakout. Since the breakout rally, the OM token price has surged from $3.50 to an all-time high of $9.11.
Mantra Price Chart
This accounts for a 159% price surge, making it one of the top-performing altcoins. However, with the broader market pullback, Mantra witnessed a short correction of 5.5% yesterday.
Currently, the intraday pullback accounts for 3.05%, signaling a potential correction in the near term.
OM Price Trend Reaches Crucial Crossroads
The daily price chart reveals that the uptrend is struggling to hold above the 78.6% trend-based Fibonacci level, priced at $8.2423. Despite the short-term pullback, the 20-day, 50-day, 100-day, and 200-day exponential moving average (EMA) lines maintain a bullish trend.
However, the daily RSI line suggests a potential shift in trend momentum, hinting at a possible reversal. The RSI has dropped below the overbought boundary, reflecting a significant increase in supply pressure.
As the broader market downturn continues, the technical indicators suggest a possible shift in Mantra’s trajectory.
On-Chain Data Reveals Mantra’s Strength
Despite the recent price pullback, on-chain data paints a bullish picture for Mantra. The last transaction volume has skyrocketed from $128.3 million to a 30-day high of $991.7 million.
This means that nearly $1 billion worth of OM tokens have been transacted, showcasing growing market traction. Further IntoTheBlock data reveals that 91.44% of the OM token supply, or 812.82 million tokens worth $6.43 billion, remains in profit.
However, the at-the-money zone, which ranges between $7.34 and $8.48, holds 76.08 million OM tokens. If OM token price drops below $7.34, these 76.08 million tokens will shift from profit to loss, potentially triggering further sell-offs.
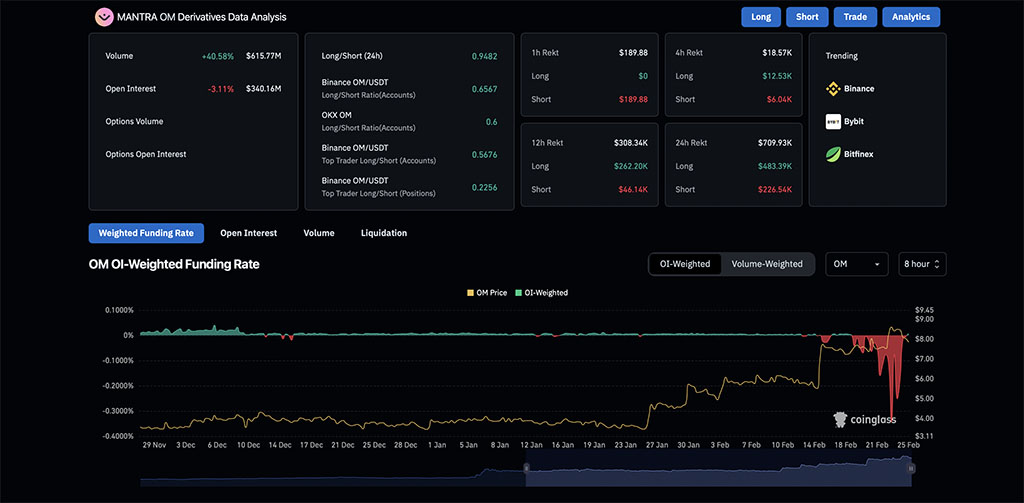
Derivatives Market: Is Volatility Rising?
Despite the highly bullish on-chain and price-action analysis, the derivatives data reveals massive fluctuations. The Mantra Open Interest is down by 4.73% to $338.81 million, indicating reduced speculative activity.
Meanwhile, the funding rate has finally turned positive after previously dropping to 0.3432%, signaling a shift in sentiment. Liquidations over the past 24 hours remain limited under $1 million, with long positions losing $484.83K.
The long-to-short ratio indicates an almost equal number of counterparties, standing at 0.9459. This suggests that market participants remain divided, with no clear dominance between bulls and bears.
Where Is Mantra (OM) Price Headed Next?
With network activity rising, the trend-based Fibonacci levels highlight a key price target at $10.51. Beyond this, the 1.272 Fibonacci extension level suggests an optimistic target of $14.32.
However, if corrections persist, the 20-day EMA at $7.09 will act as a first line of defense. If selling pressure increases, the 50-day EMA near the 50% Fibonacci level at $6 serves as critical support for a potential rebound.
Disclaimer: Coinspeaker is committed to providing unbiased and transparent reporting. This article aims to deliver accurate and timely information but should not be taken as financial or investment advice. Since market conditions can change rapidly, we encourage you to verify information on your own and consult with a professional before making any decisions based on this content.
Vishal, a Bachelor of Science graduate, began his journey in the crypto space during the 2021 bull run and has since navigated the subsequent market winter. With a strong technical background, he is dedicated to delivering insightful articles rich in technical details, empowering readers to make well-informed decisions.