Fantasy Pepe ($FEPE) is a new crypto project blending meme culture, AI simulations, and fantasy football gameplay into a Web3 expe...
Comprehensive Bitcoin Price Prediction: Analyzing Future Trends and Market Dynamics
by Tony Frank · 25 mins read
This in-depth analysis examines the key forces driving Bitcoin’s price, from supply mechanics and regulatory shifts to institutional adoption and market sentiment. Backed by historical context and forward-looking projections, the article offers actionable insights for investors navigating BTC’s evolving landscape through 2025, 2026, and beyond.
Bitcoin’s price has long been a topic of intense speculation, strategic analysis, and global debate. As the cryptocurrency ecosystem evolves, understanding the mechanics behind Bitcoin’s valuation becomes essential not only for traders and investors but also for institutions, regulators, and everyday users entering the space.
This comprehensive guide explores the core factors that influence Bitcoin’s price trajectory — from historical trends and supply mechanics to technical indicators, macroeconomic pressures, and the growing role of institutional investors. By examining both short- and long-term forecasting methods, it provides a well-rounded perspective on where Bitcoin might be headed and what variables could shape that path.
Introduction to Bitcoin Price Predictions
Predicting Bitcoin’s future price has become a central focus for analysts, traders, and institutions as they navigate the evolving world of digital assets. As Bitcoin continues to establish itself as both a speculative asset and a potential store of value, understanding the forces that drive its price — and attempting to forecast where it might go next — is more relevant than ever.

Photo: Official Bitcoin Website.
This section explores why Bitcoin price predictions are important and how historical trends influence expectations about its future trajectory.
Understanding the Importance of Bitcoin Price Forecasts
Bitcoin price prediction has become one of the most closely watched and debated topics in the cryptocurrency ecosystem. As the first and most valuable digital asset, Bitcoin continues to shape investor sentiment and market dynamics across the entire crypto landscape.
What makes Bitcoin particularly susceptible to interest driven by forecasts is its extreme volatility. With price swings that can reach double-digit percentages within a single day, BTC offers both high risk and high reward, attracting traders, long-term investors, and institutions alike. Its finite supply, halving events, and sensitivity to macroeconomic shifts only deepen the complexity of predicting future price movements.
Moreover, as Bitcoin increasingly intersects with traditional finance, from being listed on major exchanges to serving as the basis for ETFs and a treasury asset for public companies, the demand for credible and data-driven price predictions has surged. Institutional players, hedge funds, and even governments are now paying close attention to where Bitcoin might go next. Accurate forecasts help manage risk, inform investment strategies, and anticipate broader market trends, making them essential for anyone involved in the digital asset space.
Historical Performance of BTC Price Movements, Bull Markets
To understand Bitcoin’s future, it’s essential to examine its past. Since its launch in 2009, Bitcoin has undergone several dramatic market cycles. Its first notable rally came in 2013, when BTC surged from around $100 to over $1,000 — a tenfold increase that captured mainstream attention for the first time.
The current price of Bitcoin is BTC $88 427 24h volatility: 1.1% Market cap: $1.75 T Vol. 24h: $36.35 B , and its market capitalization is $1.68 trillion.
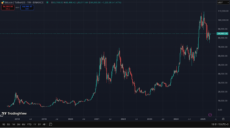
BTC Price Historical Data. Photo: TradingView.
The 2017 bull market pushed Bitcoin to nearly $20,000, driven by growing public awareness and speculative momentum. A prolonged bear market followed this throughout 2018, during which prices fell over 80%, highlighting the asset’s high-risk nature. Another historic milestone came in late 2020 through 2021, as institutional adoption and inflationary concerns fueled a rally past $60,000.
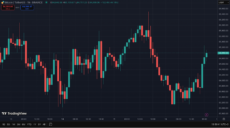
BTC Today’s Price. Photo: TradingView.
Each of these cycles — characterized by rapid price appreciation followed by sharp corrections — has played a crucial role in shaping investor behavior and market analysis frameworks. While past performance doesn’t guarantee future outcomes, it provides valuable context for identifying patterns, sentiment shifts, and macroeconomic triggers that could influence the next major move.
Factors Influencing Bitcoin’s Price
A complex interplay of internal mechanics and external market forces influences the price of Bitcoin. While volatility is a defining trait of the asset, its movements are far from random. From predictable supply-based events, such as halvings, to unpredictable geopolitical shifts and macroeconomic changes, a range of factors converge to shape BTC’s valuation at any given moment. Understanding these drivers is essential for anyone seeking to navigate — or anticipate — the next move in the crypto market.
Supply and Demand Dynamics in the Bitcoin Market
At the core of Bitcoin’s value proposition is its fixed supply. With a hard cap of 21 million coins, scarcity is baked into the protocol. This limited supply, combined with growing demand, naturally supports long-term upward pressure on price. A key mechanism that reinforces this scarcity is the halving event, which occurs approximately every four years and halves the block reward for miners. Historically, these events have preceded significant bull markets, as reduced issuance meets increasing market interest.
Beyond halvings, daily trading volume and mining activity also influence price dynamics. As more users enter the market and liquidity rises, demand can outpace supply, especially during periods of heightened retail or institutional interest. On the other hand, reduced mining profitability or network congestion can temporarily suppress enthusiasm, leading to short-term volatility.
Impact of Regulatory Developments on Bitcoin Adoption
Bitcoin operates within a global financial system where regulatory clarity, or uncertainty, can significantly shift market sentiment. Announcements of crypto-friendly frameworks, licensing regimes, or tax reforms tend to boost investor confidence and drive price appreciation. Conversely, restrictive policies, outright bans, or aggressive enforcement actions often trigger sell-offs.
For example, the U.S. Securities and Exchange Commission (SEC) plays a major role in shaping market expectations through its stance on ETFs, crypto exchanges, and token classifications. In contrast, jurisdictions like Switzerland, Singapore, and the UAE have embraced more supportive frameworks, attracting capital and encouraging innovation. In emerging markets, regulatory crackdowns — such as those seen in China and India — have led to sudden drops in Bitcoin’s valuation, demonstrating the asset’s sensitivity to legal environments.
The Role of Institutional Adoption in Shaping Bitcoin’s Future
The growing presence of institutional capital has transformed Bitcoin from a fringe asset into a legitimate component of modern portfolios. Hedge funds, asset managers, and publicly traded companies are not only investing in BTC but also building products around it, from spot ETFs to custody solutions and structured notes.
Institutional adoption enhances liquidity and introduces longer-term investment strategies that help stabilize the market. It also legitimizes Bitcoin in the eyes of regulators and traditional investors. As firms like BlackRock, Fidelity, and MicroStrategy continue to deepen their exposure, they send a clear signal: Bitcoin is more than a speculative trade — it’s a strategic asset.
Technological Advancements and Their Effect on the Bitcoin Network
While Bitcoin’s core protocol remains intentionally conservative, ongoing innovation continues to strengthen its infrastructure. Scalability solutions, such as the Lightning Network, enable faster and cheaper transactions, expanding Bitcoin’s utility beyond just a store of value. Improvements in privacy and interoperability, along with innovations like Taproot, enhance the network’s functionality and resilience.
Moreover, advancements in mining efficiency, wallet technology, and cross-chain integrations contribute to broader adoption and user confidence. As the ecosystem matures, each technical upgrade helps reinforce the long-term investment case for Bitcoin.
Macroeconomic Indicators and Their Correlation with Bitcoin
Bitcoin does not exist in a vacuum. Its price is increasingly tied to macroeconomic indicators that shape the broader financial landscape. Rising interest rates, inflationary pressure, and currency devaluation have all become key drivers of crypto market sentiment.
For instance, during periods of high inflation or geopolitical instability, Bitcoin is often seen as a hedge against fiat currency debasement, despite ongoing debates about its effectiveness in that role. Meanwhile, correlations between BTC and traditional equities, especially tech stocks, have fluctuated depending on market cycles and liquidity conditions. Understanding these relationships is crucial for assessing Bitcoin’s role within diversified portfolios and anticipating its response to global economic shifts.
Short-Term Bitcoin Price Prediction (2025)
Bitcoin’s short-term price prediction is shaped by a volatile mix of technical signals, macroeconomic developments, and shifting investor sentiment. With BTC continuing to trade within a dynamic range, analysts are closely monitoring key indicators, including trading volume, support and resistance levels, and momentum oscillators, to anticipate the asset’s next move.
Recent market behavior suggests that Bitcoin is consolidating after a period of heightened volatility, with price action largely influenced by interest rate expectations, ETF inflows, and liquidity conditions across global markets. In the near term, a breakout above resistance zones could open the door to renewed bullish momentum, especially if supported by favorable macroeconomic news or continued institutional demand. Conversely, a breakdown below critical support could trigger short-term corrections, driven by risk-off sentiment or profit-taking among short-term holders.
As always in the crypto space, short-term price predictions remain highly speculative, and traders should be prepared for rapid shifts driven by news cycles, regulatory signals, or large on-chain movements.
| Month | Minimum Price | Average Price | Maximum Price | Potential ROI |
| Apr 2025 | 84,750 $ | 114,547 $ | 126,612 $ | 49.21% |
| May 2025 | 90,471 $ | 97,017 $ | 108,875 $ | 28.31% |
| Jun 2025 | 92,215 $ | 96,574 $ | 99,178 $ | 16.88% |
| Jul 2025 | 97,316 $ | 132,129 $ | 157,098 $ | 85.14% |
| Aug 2025 | 145,923 $ | 163,141 $ | 180,328 $ | 112.52% |
| Sep 2025 | 139,611 $ | 142,636 $ | 145,312 $ | 71.25% |
| Oct 2025 | 135,086 $ | 137,653 $ | 141,373 $ | 66.61% |
| Nov 2025 | 124,478 $ | 128,064 $ | 134,792 $ | 58.85% |
| Dec 2025 | 122,894 $ | 123,822 $ | 124,518 $ | 46.74% |
Medium-Term Bitcoin Price Prediction (2026)
In the medium term — spanning the next 6 to 12 months — Bitcoin’s price trajectory will likely be shaped by a combination of macroeconomic trends, regulatory developments, and market maturation. As inflation data, interest rate policies, and institutional inflows continue to evolve, Bitcoin’s role as a strategic asset will face both opportunities and challenges.
Many analysts view the approval and growth of spot Bitcoin ETFs as a structural catalyst, potentially driving sustained demand and reducing volatility. In parallel, the upcoming Bitcoin halving — historically a key bullish trigger — is expected to shift the supply-demand balance and draw renewed attention from investors. However, potential regulatory actions, especially in key markets like the U.S. and the EU, could introduce uncertainty and temporarily slow momentum.
Overall, the medium-term outlook remains cautiously optimistic, with price targets ranging widely depending on the strength of macro headwinds or tailwinds. A move toward $80,000 or beyond is viewed as plausible by some, provided that liquidity conditions remain favorable and institutional participation continues to grow.
| Month | Minimum Price | Average Price | Maximum Price | Potential ROI |
| Jan 2026 | 119,734 $ | 123,147 $ | 125,844 $ | 48.29% |
| Feb 2026 | 119,347 $ | 120,729 $ | 122,185 $ | 43.98% |
| Mar 2026 | 117,963 $ | 128,291 $ | 132,314 $ | 55.91% |
| Apr 2026 | 124,751 $ | 131,508 $ | 142,049 $ | 67.39% |
| May 2026 | 104,211 $ | 120,160 $ | 141,436 $ | 66.66% |
| Jun 2026 | 103,638 $ | 104,777 $ | 105,639 $ | 24.48% |
| Jul 2026 | 100,841 $ | 102,931 $ | 106,255 $ | 25.21% |
| Aug 2026 | 99,787 $ | 100,637 $ | 101,402 $ | 19.49% |
| Sep 2026 | 99,153 $ | 101,348 $ | 103,097 $ | 21.49% |
| Oct 2026 | 95,241 $ | 96,737 $ | 100,130 $ | 17.99% |
| Nov 2026 | 95,322 $ | 100,958 $ | 105,081 $ | 23.82% |
| Dec 2026 | 97,856 $ | 103,024 $ | 106,062 $ | 24.98% |
Long-Term Bitcoin Price Prediction (2030)
Over the long term, Bitcoin is increasingly viewed as a maturing asset with the potential to become a core component of global investment portfolios. With a fixed supply, growing institutional adoption, and rising integration into traditional financial infrastructure, many market participants see Bitcoin as a long-term store of value, often referred to as “digital gold.”
Forecasts for the next five to ten years vary widely. Still, bullish scenarios often project Bitcoin reaching six-figure territory, driven by broader adoption, regulatory clarity, and ongoing debasement of fiat currencies. The continued development of Bitcoin-based financial products, such as spot ETFs, and its use in sovereign reserves or payment networks, could further reinforce its position.
However, the long-term outlook also carries structural risks — from potential protocol-level challenges to competition from central bank digital currencies (CBDCs) or alternative cryptoassets. Despite these uncertainties, Bitcoin’s strong network effects, brand recognition, and historical resilience position it as a leading contender in the future of digital finance.
| Month | Minimum Price | Average Price | Maximum Price | Potential ROI |
| Jan 2030 | 266,563 $ | 280,936 $ | 295,577 $ | 248.25% |
| Feb 2030 | 285,107 $ | 289,027 $ | 293,633 $ | 245.96% |
| Mar 2030 | 279,036 $ | 281,672 $ | 285,741 $ | 236.66% |
| Apr 2030 | 279,979 $ | 282,209 $ | 285,131 $ | 235.94% |
| May 2030 | 278,501 $ | 280,273 $ | 282,971 $ | 233.40% |
| Jun 2030 | 274,789 $ | 279,875 $ | 282,266 $ | 232.57% |
| Jul 2030 | 259,761 $ | 266,605 $ | 273,870 $ | 222.67% |
| Aug 2030 | 255,562 $ | 259,181 $ | 263,228 $ | 210.14% |
| Sep 2030 | 260,291 $ | 261,117 $ | 263,122 $ | 210.01% |
| Oct 2030 | 260,476 $ | 262,493 $ | 264,451 $ | 211.58% |
| Nov 2030 | 218,119 $ | 241,495 $ | 261,284 $ | 207.85% |
| Dec 2030 | 198,574 $ | 208,663 $ | 217,280 $ | 156.00% |
Comparative Analysis with Other Digital Assets
As the first and most widely recognized cryptocurrency, Bitcoin often serves as the benchmark against which all other digital assets are measured. While it dominates headlines and market capitalization rankings, its performance and structure differ significantly from those of other major cryptocurrencies.
Understanding how Bitcoin compares, particularly to Ethereum and altcoins, provides critical insight into the evolving dynamics of the digital asset landscape.
Bitcoin vs. Ethereum: Price Trends and Market Cap Comparisons
Bitcoin and Ethereum represent two fundamentally different approaches to blockchain technology and digital value. Bitcoin, often described as “digital gold,” is designed primarily as a store of value with a fixed supply of 21 million coins. Its price trends tend to reflect macroeconomic narratives, institutional sentiment, and demand driven by scarcity.
Ethereum, on the other hand, powers a decentralized application ecosystem and operates with a more flexible monetary policy. After transitioning to a proof-of-stake consensus mechanism, Ethereum has introduced deflationary elements through EIP-1559, which burns a portion of transaction fees, contrasting with Bitcoin’s strict emission schedule.
In terms of market capitalization, Bitcoin has consistently held the top position, often accounting for over 40% of the total crypto market cap. However, Ethereum has closed the gap during periods of heightened activity in DeFi and NFTs. Price-wise, Ethereum tends to exhibit higher volatility, driven by innovation cycles and network upgrades, whereas Bitcoin’s movements are more closely tied to broader economic shifts and institutional flows.
Performance of Bitcoin Relative to Other Cryptocurrencies
Despite thousands of new tokens entering the market, Bitcoin remains the dominant force in the digital asset space. It serves as the primary entry point for new investors, a liquidity anchor for trading pairs, and a macroeconomic indicator for the crypto sector as a whole. When Bitcoin moves, the rest of the market often follows — a phenomenon known as the “Bitcoin effect.”
While some altcoins occasionally outperform BTC during speculative phases, few can match its resilience across multiple market cycles. Bitcoin’s established infrastructure, security, and institutional acceptance give it a stability that many emerging assets lack. However, in bull markets, capital tends to rotate from Bitcoin into riskier assets in pursuit of higher returns, temporarily reducing its market dominance.
Still, Bitcoin’s performance relative to altcoins remains a key metric for evaluating market sentiment. When BTC dominance rises, it often signals a flight to safety or early-stage accumulation. When it falls, it can indicate heightened risk appetite or the rise of new narratives within the crypto space.
The Impact of Bitcoin ETFs on Price Dynamics
The approval and launch of Bitcoin exchange-traded funds (ETFs) mark a pivotal moment in the asset’s integration into traditional financial systems. By offering regulated exposure to BTC without the complexities of direct custody, ETFs are reshaping how retail and institutional investors engage with the market. Their influence on price dynamics, liquidity, and investor behavior continues to grow as adoption accelerates.
Understanding Spot Bitcoin ETFs and Their Market Influence
Spot Bitcoin ETFs represent a significant evolution in crypto-based investment products. Unlike futures-based ETFs, which derive their value from contracts speculating on Bitcoin’s price, spot ETFs are backed by actual Bitcoin held in custody. This direct exposure aligns the product more closely with real-time market movements and adds buying pressure to the spot market whenever shares are created or redeemed.
One of the key impacts of spot Bitcoin ETFs is increased accessibility. Traditional investors who were previously hesitant to navigate crypto wallets or unregulated exchanges can now gain exposure to BTC through familiar brokerage platforms. This broader access has the potential to boost inflows and stabilize demand, particularly from retirement funds, wealth managers, and institutional allocators.
Moreover, the launch of spot ETFs introduces new dynamics into Bitcoin’s price behavior. On one hand, ETF-driven demand can reduce volatility over time by encouraging longer holding periods. On the other hand, the sheer scale of inflows — or outflows — tied to ETF movements can amplify short-term price swings, especially during periods of macro uncertainty or regulatory developments. Ultimately, spot ETFs help deepen Bitcoin’s integration into traditional markets, reinforcing its legitimacy and long-term valuation.
Investor Behavior in Response to Bitcoin Exchange-Traded Funds
The introduction of Bitcoin ETFs has noticeably shifted investor behavior. For retail participants, ETFs offer a low-barrier entry point, making it easier to include Bitcoin in diversified portfolios without the friction of navigating digital asset infrastructure. This convenience has contributed to a wave of passive exposure, where BTC becomes part of broader investment strategies rather than a standalone speculative bet.
Institutional investors, meanwhile, are responding with a mix of strategic allocation and tactical positioning. The presence of regulated ETFs has made it easier for pension funds, insurance companies, and asset managers to justify Bitcoin exposure under existing risk frameworks. Additionally, ETFs offer intraday liquidity and clearer compliance pathways, which appeal to investors bound by strict fiduciary duties.
Notably, the psychological impact of ETF approval cannot be underestimated. For many market participants, regulatory acceptance signals maturity, encouraging more conservative capital to flow into the space. This shift in perception, combined with the mechanical demand generated by ETF inflows, creates a feedback loop that can support sustained upward pressure on Bitcoin’s price.
Market Sentiment and Its Effect on Bitcoin’s Price
Market sentiment plays a pivotal role in driving Bitcoin’s price, often amplifying moves beyond what fundamentals alone would justify. In a space where emotions and narratives evolve rapidly, perception can become a self-fulfilling force. Traders and long-term investors alike monitor sentiment indicators to gauge crowd psychology and anticipate potential shifts in momentum.
Assessing Bullish and Bearish Trends in the Crypto Community, Greed Index
Bullish and bearish cycles in the crypto market are frequently sentiment-driven, with sharp emotional swings shaping both short- and long-term price action. During bullish periods, optimism and speculative fervor tend to dominate. Social feeds overflow with price targets and success stories, and retail participation often surges. This environment feeds into upward momentum, attracting new capital and driving prices higher, sometimes well beyond sustainable valuations.
Conversely, bear markets often set in with equal intensity. As sentiment turns negative, fear and doubt ripple through the community, triggering panic selling, exchange outflows, and disengagement. The result is a feedback loop of falling prices and declining interest, until a new accumulation phase begins.
Tools like the Crypto Fear & Greed Index offer valuable snapshots of market mood, synthesizing data from volatility, volume, social media, surveys, and dominance metrics. Extreme readings on either end often coincide with turning points. For instance, “extreme greed” can suggest overbought conditions and impending correction, while “extreme fear” may indicate a buying opportunity for contrarian investors.
The Role of Media and Public Perception in Shaping Market Sentiment
The media — both traditional and digital — wields significant power over how Bitcoin is perceived. Positive headlines, such as regulatory approval of ETFs or institutional endorsements, tend to spark enthusiasm and drive prices upward. Conversely, negative coverage — whether from enforcement actions, exchange hacks, or critical commentary from influential figures — can quickly undermine confidence.
Social media platforms like X (formerly Twitter), Reddit, and TikTok also play a growing role in shaping real-time sentiment. Influencers and thought leaders with large followings can quickly move markets through commentary or speculation, often bypassing traditional media filters. The rise of “crypto Twitter” has effectively turned sentiment into a decentralized, crowd-driven signal that traders monitor as closely as technical charts.
Memes, trends, and viral narratives — whether around Bitcoin ETFs, halving hype, or macroeconomic catalysts — can fuel buying sprees or mass exits. This makes sentiment not just a reflection of market conditions, but an active force in creating them. In such an environment, understanding the emotional pulse of the community becomes as important as analyzing charts or fundamentals.
Technical Analysis Tools for Bitcoin Price Prediction
Technical analysis remains one of the most widely used approaches to forecasting Bitcoin’s price movements. By examining historical price data, volume, and chart patterns, traders aim to identify trends, momentum shifts, and key decision points in the market. While no tool offers guaranteed predictions, certain indicators, when used in context, can offer valuable insights into potential future price action. Below are some of the core instruments used by analysts to assess Bitcoin’s technical landscape.
Utilizing Relative Strength Index (RSI) in Forecasting
The Relative Strength Index (RSI) is a momentum oscillator that measures the speed and change of price movements. It is typically plotted on a scale from 0 to 100 and is primarily used to identify overbought or oversold market conditions. When RSI crosses above 70, it may signal that Bitcoin is overbought and due for a correction. Conversely, a reading below 30 suggests oversold conditions, which could precede a price rebound.
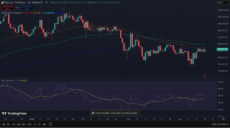
BTC Latest Data. Photo: TradingView.
For Bitcoin traders, RSI serves as a gauge of market sentiment and short-term exhaustion. During bull markets, RSI often hovers in the higher range, reflecting sustained buying pressure. However, divergences — where price makes new highs but RSI fails to follow — can indicate weakening momentum and a potential reversal ahead. As such, RSI is a popular tool for timing entries and exits in volatile crypto environments.
Moving Averages and Their Significance in Trend Analysis
Moving averages help smooth out price data to identify the underlying trend’s direction. Common types include the simple moving average (SMA) and exponential moving average (EMA), with popular periods being the 50-day, 100-day, and 200-day averages.
In the Bitcoin market, moving averages are often used to define support and resistance zones or confirm bullish and bearish trends. For instance, when the price crosses above the 200-day moving average, it is generally seen as a bullish signal, indicating upward momentum. Conversely, a breakdown below major moving averages can mark the beginning of a bearish phase.
Golden crosses (when the 50-day moving average crosses above the 200-day moving average) and death crosses (the opposite scenario) are especially notable events for technical analysts, often used to reinforce medium- to long-term forecasts.
Identifying Support and Resistance Levels in Bitcoin Trading
Support and resistance levels represent price zones where Bitcoin has historically struggled to break through, either on the downside or upside. Support acts as a floor where demand tends to outweigh selling pressure, while resistance serves as a ceiling where selling pressure exceeds buying interest.
Traders and analysts closely monitor these levels to anticipate potential breakouts or reversals. If Bitcoin approaches a well-established support level and holds, it can suggest a buying opportunity. Alternatively, if resistance is repeatedly tested and eventually broken, it may signal the start of a new upward trend.
Chart patterns such as double tops, ascending triangles, and head-and-shoulders formations often form around key support or resistance zones, reinforcing their predictive value. By combining these levels with other technical indicators, traders can build more informed forecasts and risk management strategies.
The Influence of Global Economic Factors
Global economic conditions increasingly shape Bitcoin’s market behavior. While it originated as an alternative to traditional finance, its integration into the broader financial system has made it sensitive to macroeconomic variables. From inflation to equity markets, understanding these correlations is crucial for interpreting price movements and anticipating potential shifts in investor behavior.
Impact of Inflation Rates and Currency Devaluation on Bitcoin
Bitcoin is often positioned as a hedge against inflation and currency debasement — a digital store of value with a fixed supply and decentralized issuance. In environments where fiat currencies lose purchasing power, either due to excessive monetary expansion or geopolitical instability, Bitcoin becomes an attractive alternative for capital preservation.
In developed markets, rising inflation and loose fiscal policy have prompted institutional and retail investors alike to explore Bitcoin as a non-correlated asset. The post-pandemic era, characterized by surging inflation and declining confidence in central banks, helped fuel a narrative in which Bitcoin rivaled gold as a modern hedge against inflation.
In emerging economies, where currency devaluation is more acute and access to stable financial infrastructure is limited, Bitcoin has served a different but equally important role. In countries like Argentina, Turkey, or Nigeria, demand for BTC often spikes during periods of local currency collapse, offering citizens a means of storing value and transacting outside of unstable monetary systems.
Correlation Between Stock Market Indices and Bitcoin’s Performance
Although Bitcoin was initially viewed as uncorrelated with traditional financial markets, its increasing adoption by institutional investors has created tighter linkages between crypto and equities. Over the past few years, Bitcoin has shown varying degrees of correlation with major indices such as the S&P 500 and Nasdaq, particularly during periods of global economic uncertainty.
In times of risk-off sentiment, when investors retreat from equities and move into cash or safer assets, Bitcoin often experiences parallel drawdowns. This behavior was especially pronounced during the 2020 market crash and the tightening cycles of 2022, when BTC moved in lockstep with tech stocks. Conversely, in bullish macro environments, both equities and Bitcoin tend to benefit from increased liquidity and risk appetite.
However, these correlations are not set in stone. At times, Bitcoin decouples from stock indices, driven by crypto-specific catalysts such as regulatory changes, ETF approvals, or halving cycles. The relationship between Bitcoin and traditional markets continues to evolve, making it a dynamic — and sometimes contradictory — asset in the context of broader economic forces.
Institutional vs. Retail Investors: Who Drives the Market?
Bitcoin’s market dynamics are shaped by the interplay between institutional capital and retail participation — two forces with distinct behaviors, time horizons, and impacts. While institutions bring scale, structure, and long-term strategy, retail investors inject momentum, sentiment, and often set the pace for short-term volatility. Understanding how these groups operate helps decode who truly drives the market at different phases of the cycle.
The Growing Presence of Institutional Investors in the Cryptocurrency Space
In recent years, institutional investors have transitioned from passive observers to active participants in the cryptocurrency space. Hedge funds, asset managers, family offices, and publicly traded companies have increasingly allocated capital to Bitcoin, drawn by its potential as a hedge, a portfolio diversifier, and an alternative to traditional assets.
These players often follow structured investment theses, employing long-term accumulation strategies, over-the-counter (OTC) trades, and complex financial products such as futures, options, and ETFs. The launch of spot Bitcoin ETFs has further streamlined access, leading to greater inflows from pension funds, sovereign wealth funds, and endowments. Institutional involvement enhances market maturity and depth, but it also ties Bitcoin more closely to macroeconomic cycles and regulatory developments.
Retail Investors’ Influence on Market Liquidity and Price Movements
Despite the rise of institutional capital, retail investors remain a critical force, especially in periods of rapid price acceleration or correction. Their collective behavior drives daily trading volume, amplifies sentiment, and often sets off key inflection points through herd-driven action.
During bull runs, retail enthusiasm — fueled by media hype, social platforms, and FOMO (fear of missing out) — can push Bitcoin into overbought territory, triggering parabolic moves. Conversely, in bear markets, the same crowd may retreat en masse, accelerating price declines through panic selling and a loss of liquidity.
Retail participation also supports the decentralized ethos of Bitcoin, with millions of individual holders contributing to market liquidity across centralized and decentralized exchanges. While institutions may steer the long-term narrative, retail investors are often the ones who set the tempo of day-to-day price action.
Conclusion: Navigating the Future of Bitcoin Investments
The expected price of Bitcoin remains a subject of intense debate among market participants, as the cryptocurrency industry evolves amid shifting macroeconomic conditions and tightening anti-money laundering regulations. While concerns about a potential Bitcoin bubble occasionally resurface, many analysts expect a continued positive trend driven by the broader adoption of Bitcoin as a decentralized digital currency and increased institutional participation.
As the asset class matures, investors are paying closer attention to statistical measures such as the average price and closing price to assess future values and identify periods of bullish sentiment. A sustained bullish trend could prompt investors to reevaluate their exposure, particularly as Bitcoin becomes more closely tied to traditional financial markets and regulatory frameworks. Navigating this landscape requires a thoughtful balance of strategic positioning, risk awareness, and responsiveness to new developments shaping the long-term outlook of digital assets.
Strategies for Investors to Mitigate Risks and Capitalize on Opportunities
In the volatile and opportunity-rich cryptocurrency industry, investors are adopting more sophisticated tools and frameworks to anticipate market shifts. Tracking trend indicators such as RSI, volume surges, and moving averages allows market participants to stay ahead of bullish trends and avoid being caught in local tops or corrections.
Many apply risk-mitigation techniques, such as dollar-cost averaging, dynamic rebalancing, and scenario modeling, based on statistical measures tied to the average price or recent closing price patterns. Staying updated on anti-money laundering policies, global regulations, and institutional behavior is equally important, as these factors heavily influence future values and shape investor psychology. In a market where bullish sentiment can prompt investors to take rapid action, maintaining discipline and a long-term perspective remains crucial.
Disclaimer: This article is for informational purposes only and does not provide financial, trading, or investment advice. Cryptocurrency prices can fluctuate wildly, so always do your own research (DYOR), assess risks, and consult a professional before making financial decisions. The author and team are not responsible for any losses from using this information.
FAQ
What factors contribute most significantly to Bitcoin's price fluctuations?
Key drivers include supply and demand dynamics, investor sentiment, macroeconomic indicators, regulatory developments, and technological upgrades.
How do regulatory developments impact the cryptocurrency market?
Regulatory clarity can boost market confidence and attract institutional capital, while uncertainty or restrictive measures often lead to price volatility and reduced trading activity.
What is the projected price of Bitcoin in the next five years?
Projections vary widely, but many analysts predict that Bitcoin will reach between $100,000 and $250,000 by 2030, depending on adoption rates, macroeconomic trends, and regulatory changes.
How does institutional adoption influence Bitcoin's market value?
Institutional entry increases market liquidity, reduces volatility over time, and signals long-term confidence, often leading to upward price momentum.
What role do Bitcoin ETFs play in the overall market dynamics?
Bitcoin ETFs provide regulated, accessible exposure to BTC, attracting a broader investor base and influencing price through spot market demand.
How can technical indicators help forecast Bitcoin's price movements?
Tools like RSI, moving averages, and support and resistance levels help identify trends, momentum shifts, and potential entry or exit points.
What is the correlation between Bitcoin's price and global economic indicators?
Bitcoin often reacts to inflation, interest rates, and currency strength, positioning itself as either a risk asset or a hedge depending on macro conditions.
How does market sentiment affect Bitcoin's valuation?
Positive sentiment can drive rapid rallies fueled by retail and media hype, while fear or uncertainty often leads to sharp corrections and panic selling.
What are the risks associated with investing in Bitcoin?
Risks include extreme price volatility, regulatory changes, cyber threats, and the potential for sharp market corrections.
How to buy Bitcoin today?
To buy Bitcoin today, you can register on a reputable cryptocurrency exchange like Coinbase, Binance, or Kraken, complete identity verification, and purchase BTC using a bank transfer, credit card, or other supported payment methods. Alternatively, you can use a Bitcoin ATM or a peer-to-peer platform for more direct transactions.
How does Bitcoin's performance compare to other digital assets?
Bitcoin typically shows lower volatility and higher long-term resilience than most altcoins, often leading the market in both rallies and downturns.
What impact do interest rates have on Bitcoin's market appeal?
Higher interest rates can reduce risk appetite and divert capital away from speculative assets, such as Bitcoin, while lower rates may encourage crypto investment.
How do supply and demand dynamics shape Bitcoin's price?
Bitcoin’s fixed supply and periodic halving events create scarcity, while rising demand, especially during bull markets, drives price increases.
What are the implications of currency devaluation on Bitcoin investments?
In economies with weak or devaluing fiat currencies, Bitcoin is often seen as a safe haven, leading to increased local demand and adoption.
How do stock market trends influence the cryptocurrency market?
Bitcoin has shown increasing correlation with stock indices, particularly tech stocks, during risk-on or risk-off cycles.
What is the significance of the Relative Strength Index in Bitcoin trading?
RSI helps traders identify overbought or oversold conditions, providing signals for potential reversals or continuation of trends.
How does media coverage affect public perception and Bitcoin's price?
Positive media can spark buying sprees and mainstream interest, while negative news, especially around regulation or hacks, can trigger sell-offs.
What are the challenges in predicting Bitcoin's future price movements?
High volatility, market manipulation, external shocks, and evolving regulations make accurate long-term forecasting difficult.
How does market liquidity impact Bitcoin's volatility?
Lower liquidity can amplify price swings, while high liquidity tends to stabilize price movements and reduce slippage during large trades.
What strategies can investors employ to mitigate risks in Bitcoin investments?
Diversification, dollar-cost averaging, secure storage solutions, and disciplined profit-taking can help manage risk exposure.
How do geopolitical events influence the cryptocurrency market?
Events like wars, sanctions, or capital controls can drive demand for decentralized assets like Bitcoin, but also contribute to short-term volatility.
guides
Fantasy Pepe ($FEPE) Price Prediction 2025 – 2030
April 21st, 2025
Comprehensive Ethereum Price Prediction: Analyzing Future Trends and Market Dyna...
April 21st, 2025
How to Buy Fantasy Pepe (FEPE)
April 21st, 2025
Ethereum is more than a cryptocurrency — it’s the backbone of DeFi, NFTs, and Web3 innovation. This in-depth guide analyzes ETH’s ...
Fantasy Pepe ($FEPE) is a next-gen meme coin merging AI, NFTs, and DeFi. It powers AI-simulated football matches, token-based pred...