The meme coin has stunned the crypto community by rising over 30% in the past 24 hours, now trading around $0.57. As per the data by CoinMarketCap, FARTCOIN has also seen a 90% jump in its 24-hour trading volume, hitting $363 million.
Interestingly, this surge comes at a time when most major cryptocurrencies, including Bitcoin and Ethereum, are slumping hard. While FARTCOIN records a 130% surge in its value in the past month, the overall meme coin market lost 20% of its market cap during the same period.
What Is Causing FARTCOIN Price ?
Nansen data suggests that FARTCOIN’s exchange reserves have dropped by 3.62% in the past week, with a net outflow of 2 million tokens. This suggests that more investors are opting for self-custody, a possible sign of long-term confidence.
Meanwhile, CoinCarp indicates that the number of holders remains steady at over 113,000, despite the market turbulence. Moreover, top-performing wallets from the past week continue to hold the meme coin strong, hinting at rising price expectations among seasoned traders.
Interestingly, this isn’t the first time Fartcoin has acted as a safe haven in times of broader market panic. During last December’s Fed-induced selloff that slashed Bitcoin BTC$85 52324h volatility:2.0%Market cap:$1.70 TVol. 24h:$21.02 B
and the S&P 500, Fartcoin skyrocketed nearly 60%, jumping from $0.79 to $1.26 within eight days.
Analysts haven’t quite been able to pin down this pattern. Popular ETF analyst Eric Balchunas recently noted the token’s surge on X, raising questions on what is causing this value uptick.
Speaking of which, Fartcoin up 8% again today. Literally everything is down, even treasuries and gold. Bitcoin and Ether both in gutter. Can someone explain this? pic.twitter.com/h5m2xmB0m1
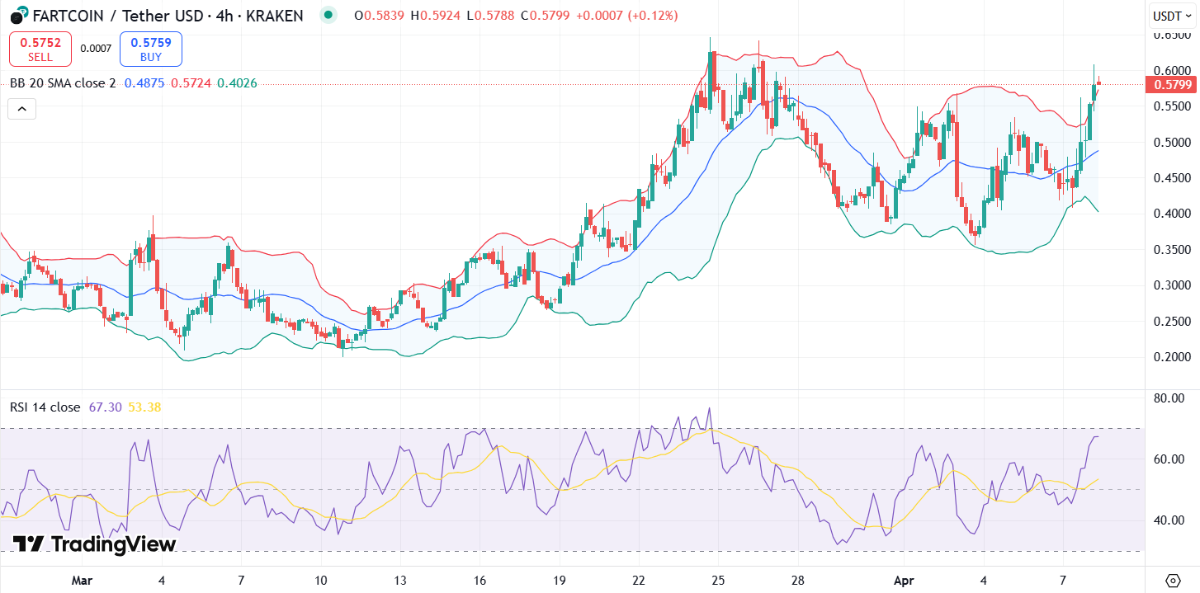
On FARTCOIN’s 4-hour chart, the price seems to be forming a bullish cup and handle pattern. The “cup” bottomed out in late March, and the recent price action hints at a developing “handle”, suggesting consolidation before a potential breakout.
The RSI sits at 67, indicating growing bullish momentum but still leaving room for further upside without immediate risk of a reversal.
Source: TradingView
Meanwhile, Bollinger Bands are beginning to expand after a squeeze, typically a sign of high volatility. The price has broken above the upper band, which can signal either overextension or strength in trend continuation.
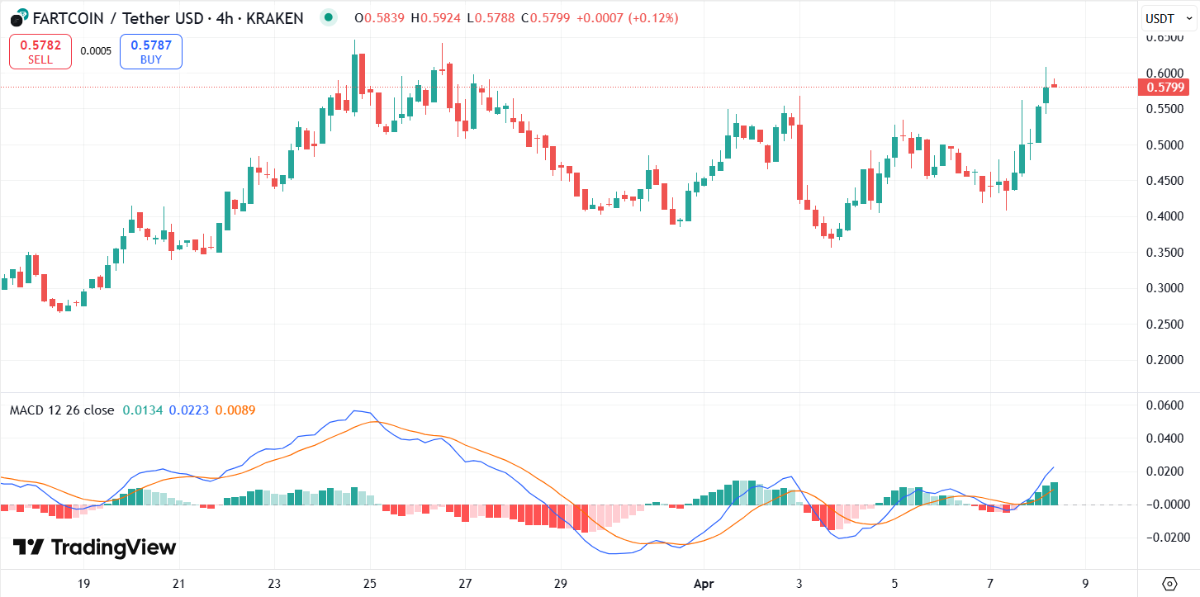
Additionally, the MACD has just crossed over its signal line, with growing green histogram bars, confirming the upward momentum.
Source: TradingView
If the breakout from the “handle” confirms above $0.60 with volume, traders could set a near-term price target of $0.72–$0.75.
Disclaimer: Coinspeaker is committed to providing unbiased and transparent reporting. This article aims to deliver accurate and timely information but should not be taken as financial or investment advice. Since market conditions can change rapidly, we encourage you to verify information on your own and consult with a professional before making any decisions based on this content.
A crypto journalist with over 5 years of experience in the industry, Parth has worked with major media outlets in the crypto and finance world, gathering experience and expertise in the space after surviving bear and bull markets over the years. Parth is also an author of 4 self-published books.