
Ethereum price recently surged above $3,700 with its chart pattern resembling Bitcoin’s breakout pattern before its November rally, which led to a 45% increase.
The Ethereum price ETH $1 845 24h volatility: 2.6% Market cap: $222.72 B Vol. 24h: $14.22 B surge above $3,700 over the weekend has created major hope of an upcoming rally to $4,000 in the near term, and further to a new all-time high. The ETH chart currently is very similar to the BTC price chart before kickstarting a 38% rally in November.
The three-line break chart for Ethereum smoothes out daily price fluctuations, and indicates an 8-month corrective trend, indicated by lower highs and lower lows, has come to an end. Such breakouts often lead to a bullish chain reaction, drawing in new buyers while forcing out sellers who had been holding back price rallies during periods of consolidation.
The Bitcoin price BTC $96 611 24h volatility: 2.1% Market cap: $1.92 T Vol. 24h: $29.09 B demonstrated a similar breakout in mid-October, thereby triggering a rally that took it to a new all-time high of $73,000. Since then the BTC price has surged 45%, reaching over $96,000.
-
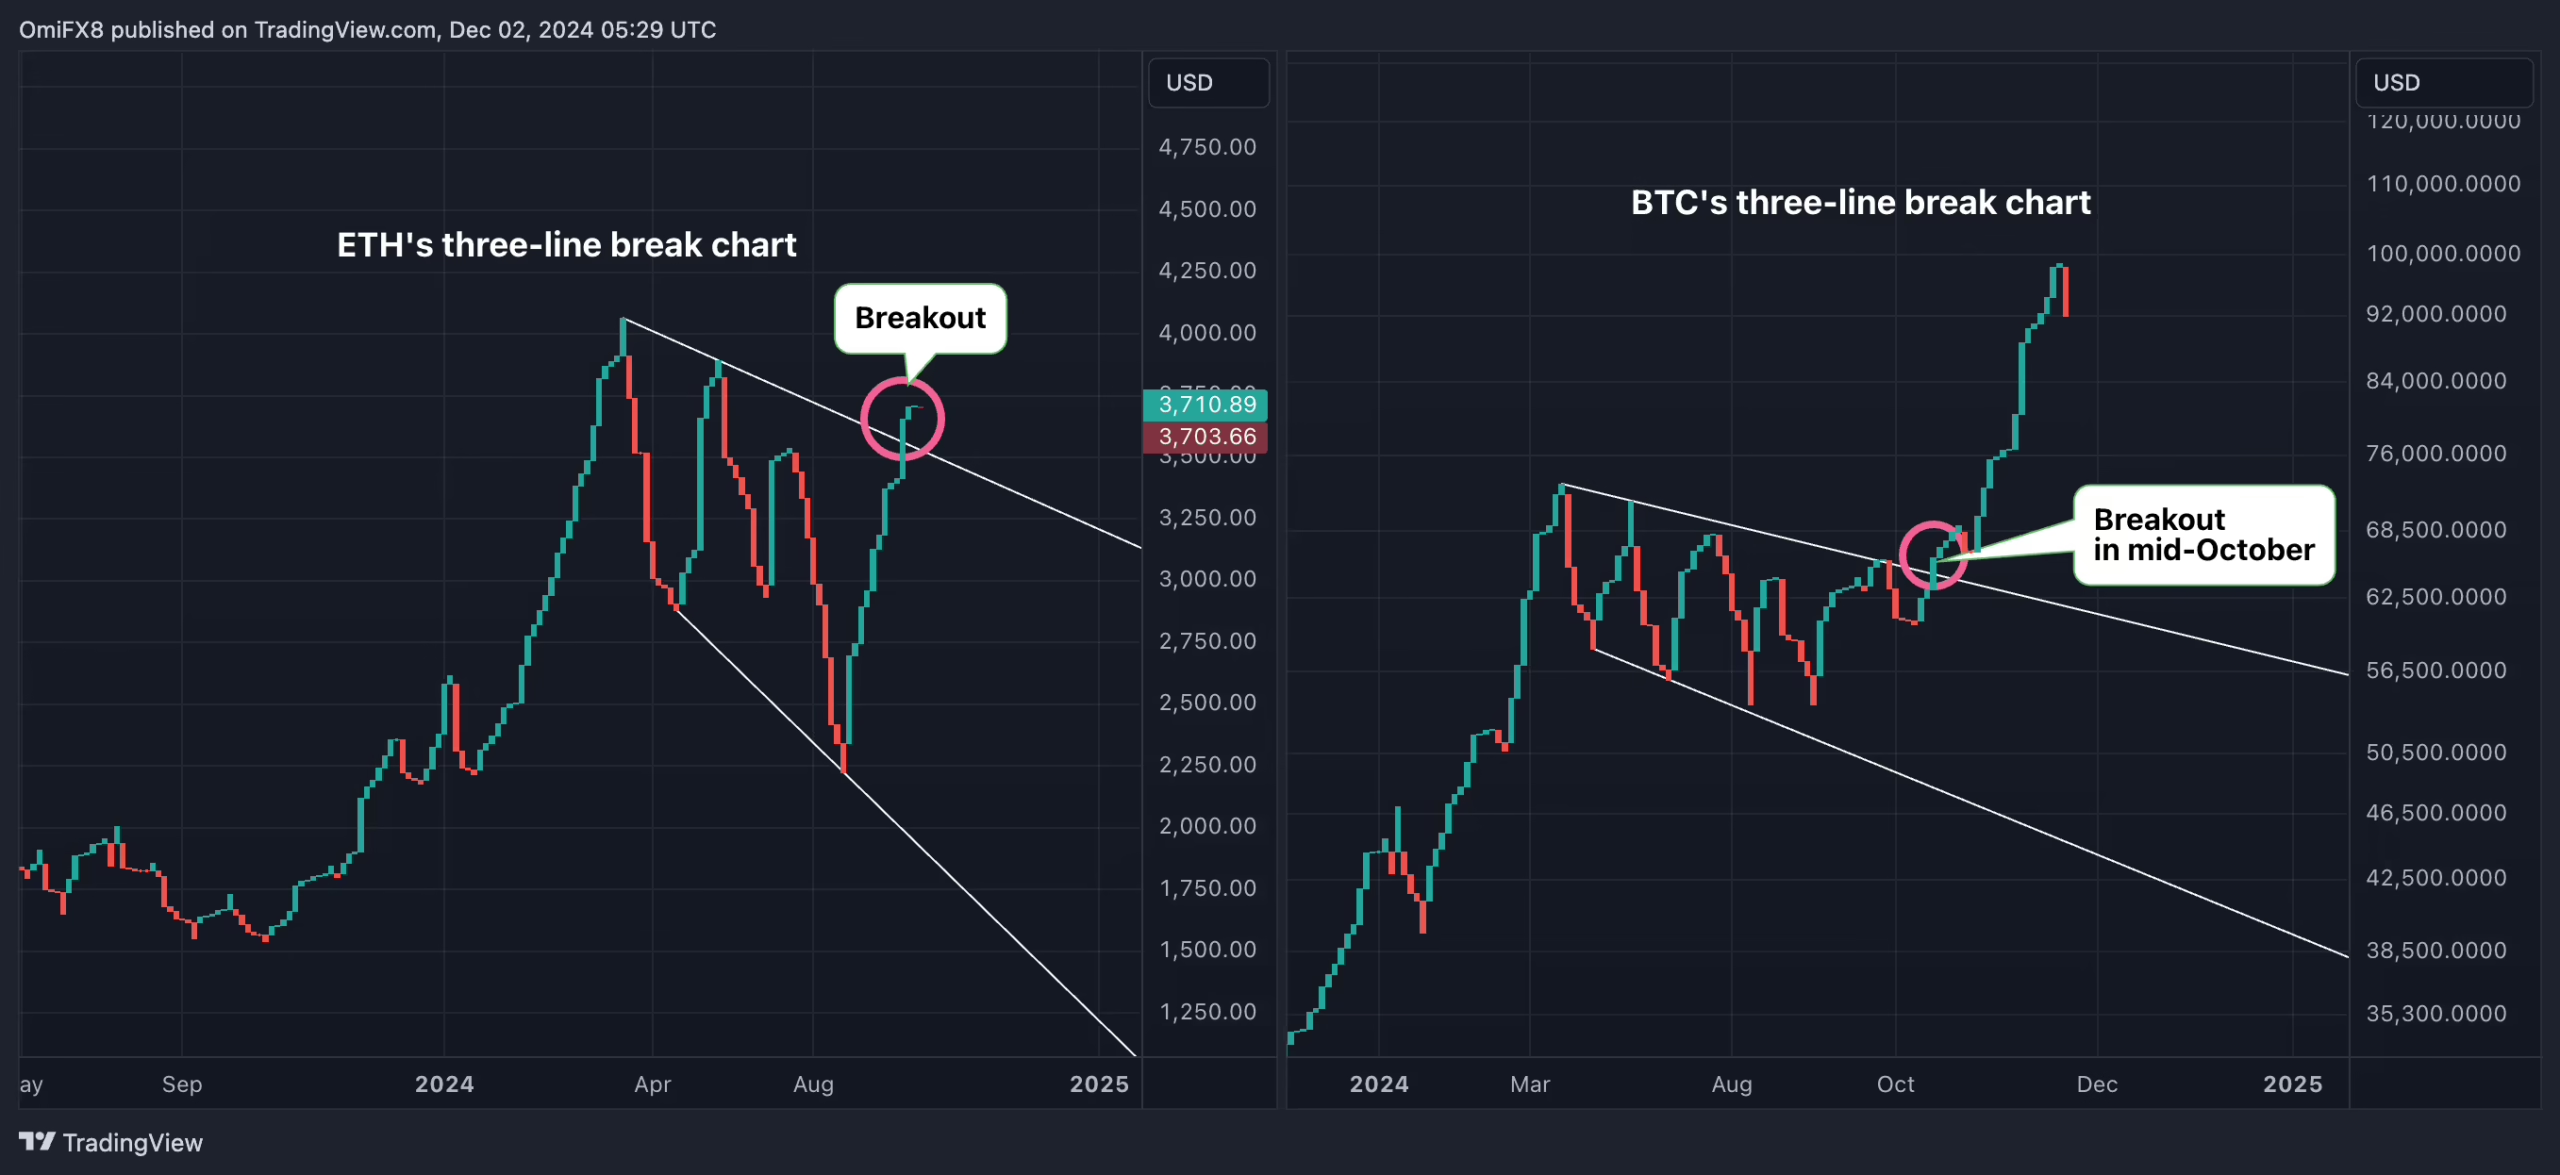
Courtesy: CoinDesk

Additionally, the recent activity on the Ethereum network supports the bullish outlook for ETH. As reported recently, the number of “blobs” posted by layer 2 protocols on Ethereum saw a sharp increase in November.
Posting blobs incur fluctuating fees paid in Ether, which are burned, similar to regular transaction fees, reducing the overall supply of ETH in the market. This would create an upward pressure on the Ethereum price moving ahead.
Ethereum Price Rally to $10,000
While the Ethereum price has yet to cross the immediate resistance of $4,000, calls for its rally to $10,000 have already picked up pace. Popular crypto analyst Titan of Crypto stated that the ETH price could be on track to hit new highs, suggesting it could be anywhere between $7,800 and $9,900.
Historical trends point to a potential top near the 141.40% Fibonacci extension, which previously marked the peak in the last cycle. If history repeats itself, some analysts believe Ethereum could approach the $10,000 mark by the end of this rally.
#Ethereum Cycle Top: $7,800–$9,900? 🚀
In the last cycle, #ETH peaked near the 141.40% Fibonacci extension.
If history repeats, this cycle’s top could approach $10K. pic.twitter.com/qnar4UqSW1
— Titan of Crypto (@Washigorira) December 1, 2024
However, the Ethereum price has been facing strong rejections at $3,700 recently. Thus, putting a daily close above this level is very important to meet the immediate target of $4,000.
On the other hand, inflows into spot Ethereum ETFs have picked up pace over the last week of November, seeing more than $550 million in weekly inflows. Last Friday, the daily inflows in spot Ethereum ETF surpassed the inflows of Bitcoin ETFs for the very first time since inception.
next