Ethereum Price Analysis: ETH/USD Trends of March 04–10, 2019
Further increase in bearish pressure will make the demand zone of $114 as the target for Ethereum price. The loss of bearish momentum will make the coin to range towards $149 price level.
By Azeez MustaphaUpdated
2 mins readPhoto: Marco Verch / Flickr
Key Highlights:
The Bears took over the control of the ETH market;
the Bearish trend may continue;
the price is currently exposed to $114 price level.
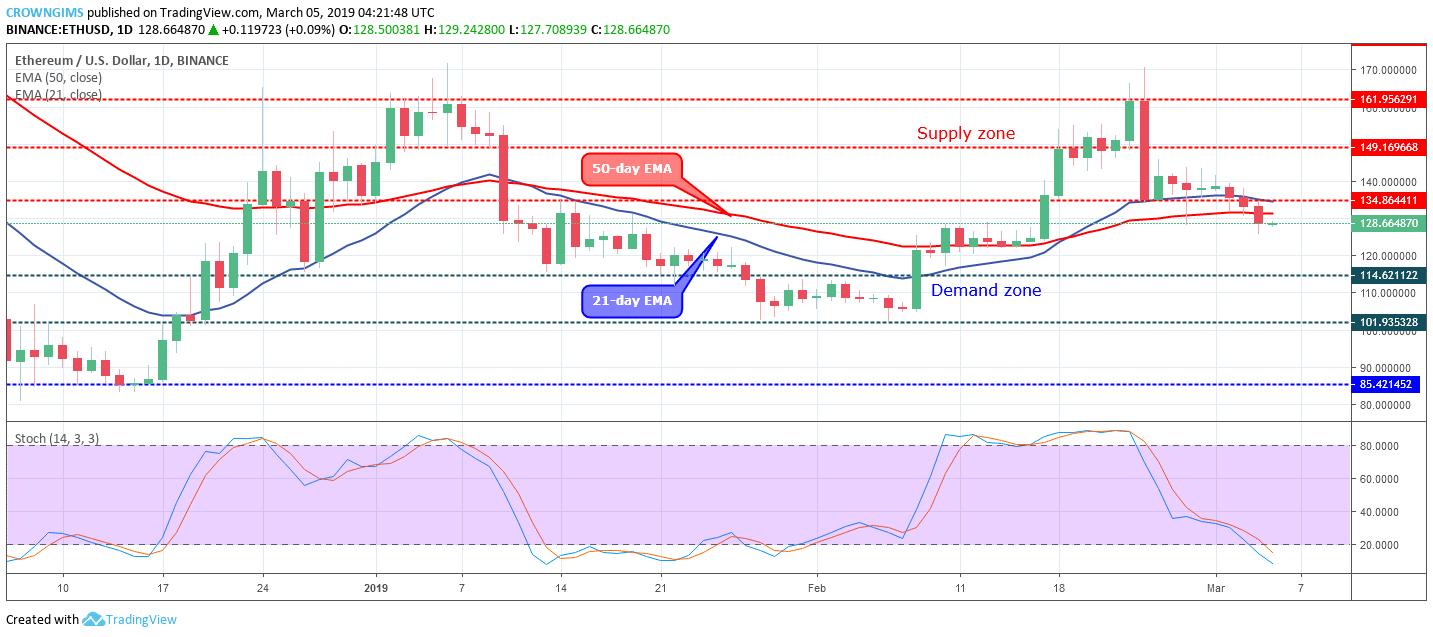
ETH/USD Long-term Trend: Bearish
Supply Zones: $134, $149, $161
Demand Zones: $114, $101, $85ETH/USD is bearish on the long-term outlook. On February 24 the Bulls topped the ETH price at the supply zone of $161. The bullish breakout of the level could not be sustained due to bear’s pressure that formed a big bearish engulfing candle.
This made Ethereum price declined to $134 price level after penetrated the $149 price level. The coin started consolidating directly on $134 level till March 2nd. The bears increased their pressure and the $134 former demand zone and the dynamic support (the two EMAs) broken downside. The coin is currently exposed to the demand zone of $114.
The ETH price has penetrated the two EMAs downside and the 21-day EMA is above the 50-day EMA which implies that the bearish momentum is increasing. Meanwhile, the Stochastic Oscillator period 14 is below 20 levels with the signal lines point down which indicates sell signal and a further decrease in Ethereum price.
Further increase in bearish pressure will make the demand zone of $114 as the target for the ETH price. The loss of bearish momentum will make the coin to range towards $149 price level.
ETH/USD Medium-term Trend: Bearish
On the medium-term outlook, Ethereum is also bearish. The evening star candle pattern formed on 24th of February around $161 supply level happened to be a bearish reversal candle pattern that declined the ETH price to $134 price level.
The bearish momentum was exhausted and could not decrease further, the scenario led to sideways movement above the $134 price level. On the 3rd of March, the bears were able to break downside the $134 price level.
The Stochastic Oscillator period 14 is at 20 levels with the signal lines interlocked which connotes consolidation is ongoing on the 4-Hour chart in the ETH market. However, Ethereum price is keeping a distance away from the two EMAs and the coin is trading under the 21-day EMA and the 50-day EMA which indicate strong bearish momentum.
Azeez Mustapha is a specialist in Computer Studies (including DTP), Forex and Crypto trading professional. Being expert technical and currency analyst, as well as experienced fund manager and author of several books, Azeez places strong focus on crypto market studies conducting comprehensive price analyses and sharing forecasts of presumptive market trends.

 ETH/USD is bearish on the long-term outlook. On February 24 the Bulls topped the ETH price at the supply zone of $161. The bullish breakout of the level could not be sustained due to bear’s pressure that formed a big bearish engulfing candle.
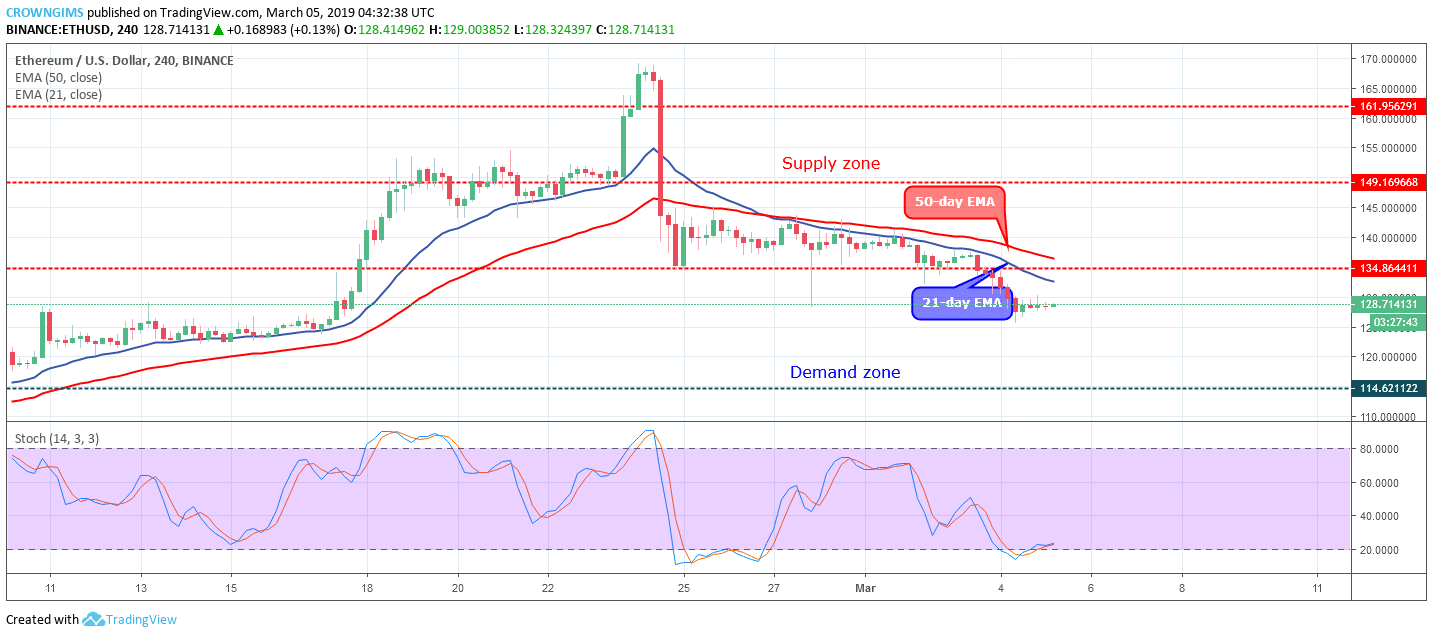 On the medium-term outlook, Ethereum is also bearish. The evening star candle pattern formed on 24th of February around $161 supply level happened to be a bearish reversal candle pattern that declined the ETH price to $134 price level.