
In case the demand level of $146 does not hold the Ethereum price may find its support at $131 – $109 price level.
Key Highlights:
- Ethereum price continue its bullish trend;
- the bulls hold tight to the ETH market;
- consolidation confirmed on the daily chart.
ETH/USD Long-term Trend: Bullish
Supply levels: $164, $187, $213
Demand levels: $146, $131, $109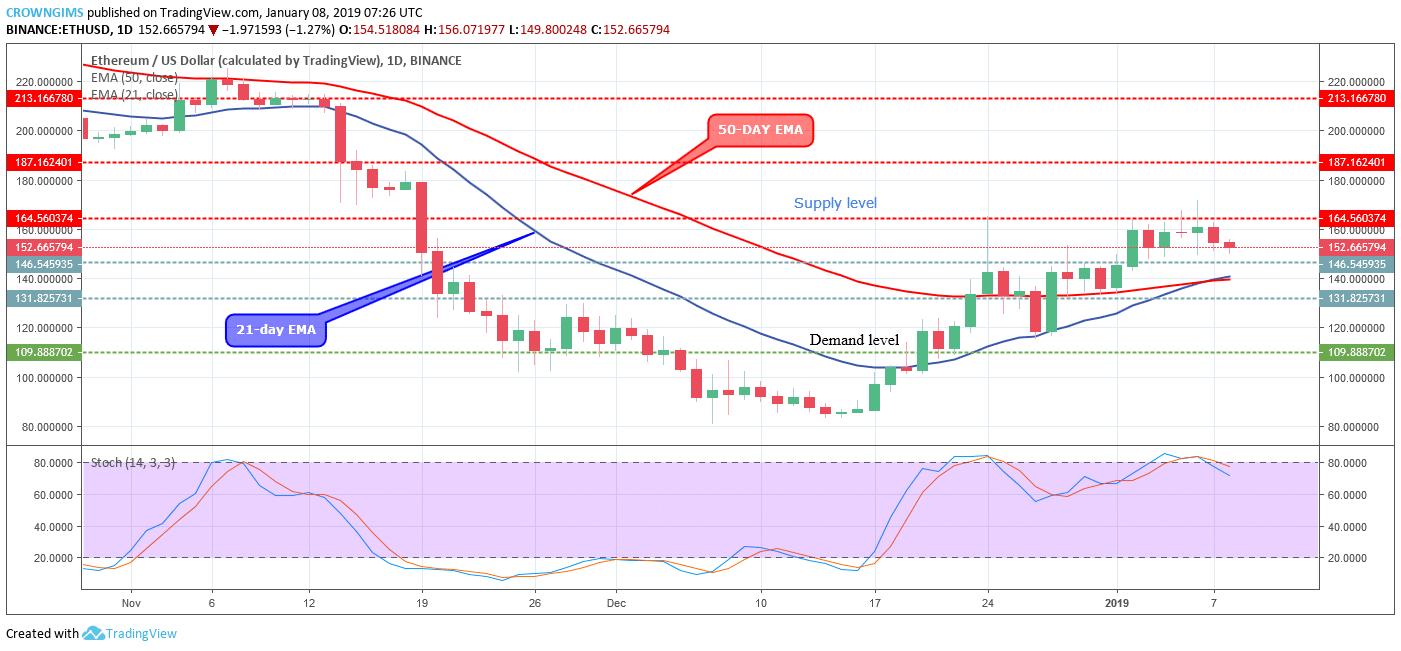

The 21-day EMA is crossing the 50-day EMA upside and the ETH price is above the two EMAs an indication that the bulls are in control of the ETH market. The Stochastic Oscillator period 14 is at 80 levels and the signal lines pointing down indicates sell signal which may serve as a pullback before bullish momentum continues.
In case the demand level of $146 does not hold the Ethereum price may find its support at $131 – $109 price level. On the other hand, the break out of the ETH price at $164 supply level may place the price at the high of $187 – $213.
ETH/USD Medium-term Trend: Bullish
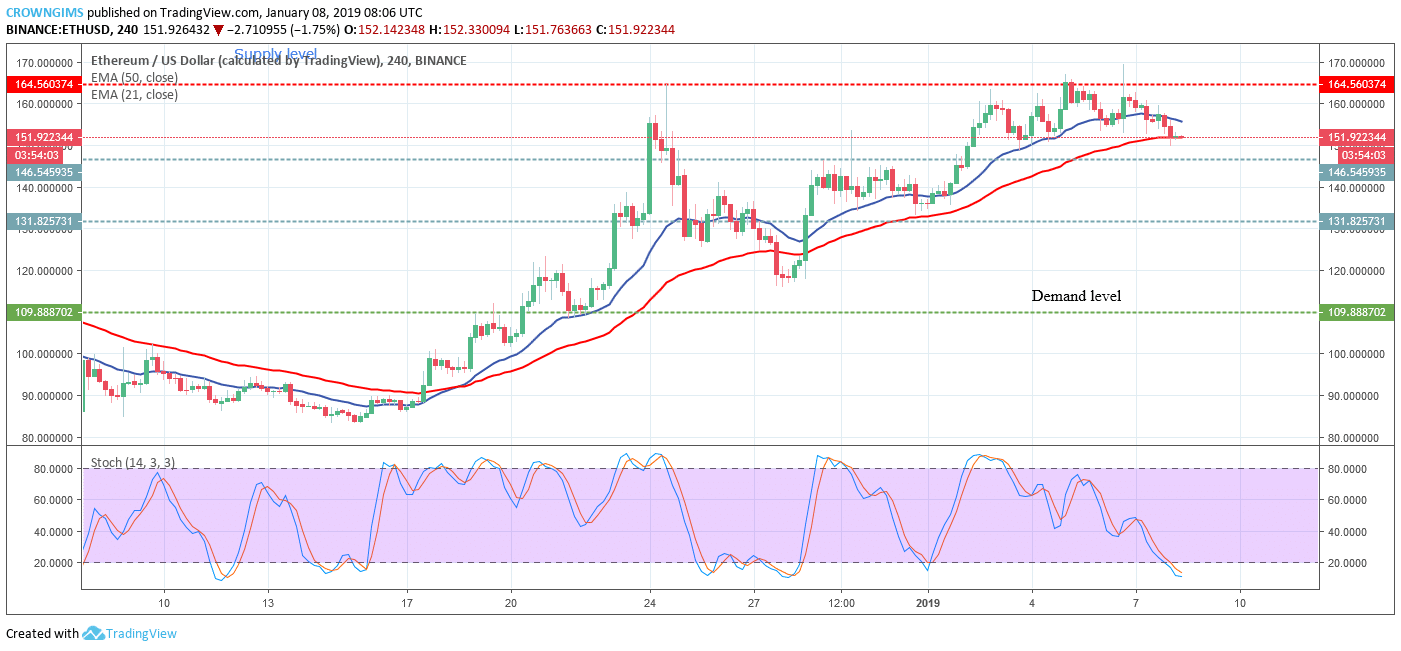
There was a price retracement towards the demand level of $109 on December 27 which took the Ethereum price below the two EMAs but the bears could not sustain the pressure. The bullish momentum was restored; the price was pushed up to the $164 supply level.
The Stochastic Oscillator period 14 is below 20 (oversold level) pointing down indicates sell signal which may be price retracement that may likely reach the $146 demand level. Traders may look out for the opportunity to go long after the price retracement.
next