Ethereum Price Analysis: ETH/USD Price Broke Down $258 Level, Targeting $225

Updated on Jul 23, 2019 at 12:21 pm UTC by · 2 mins read

Constant high momentum from the Bears will push down Ethereum price further and it may reach the demand level of $225 provided there is no much interruption from the Bulls. In case the demand level of $225 holds the price may bounce.

Key Highlights:

  • Ethereum price is consolidating at $258 – $289 levels;
  • the Bulls are prevailing;
  • Ethereum price has touched the $289 supply level.

ETH/USD Medium-term Trend: Bearish

Supply Zones: $258, $289, $287
Demand Zones: $318, $191, $102Ethereum is bearish on the medium-term outlook. Ethereum was bullish and reached a high of $289 on May 30. A bullish engulfing candle formed triggered the bearish movement that dropped the coin below $258 level. The Bulls rejected the price declination and pushed the coin back but lost the momentum and the price started consolidating at $258 level for some days.

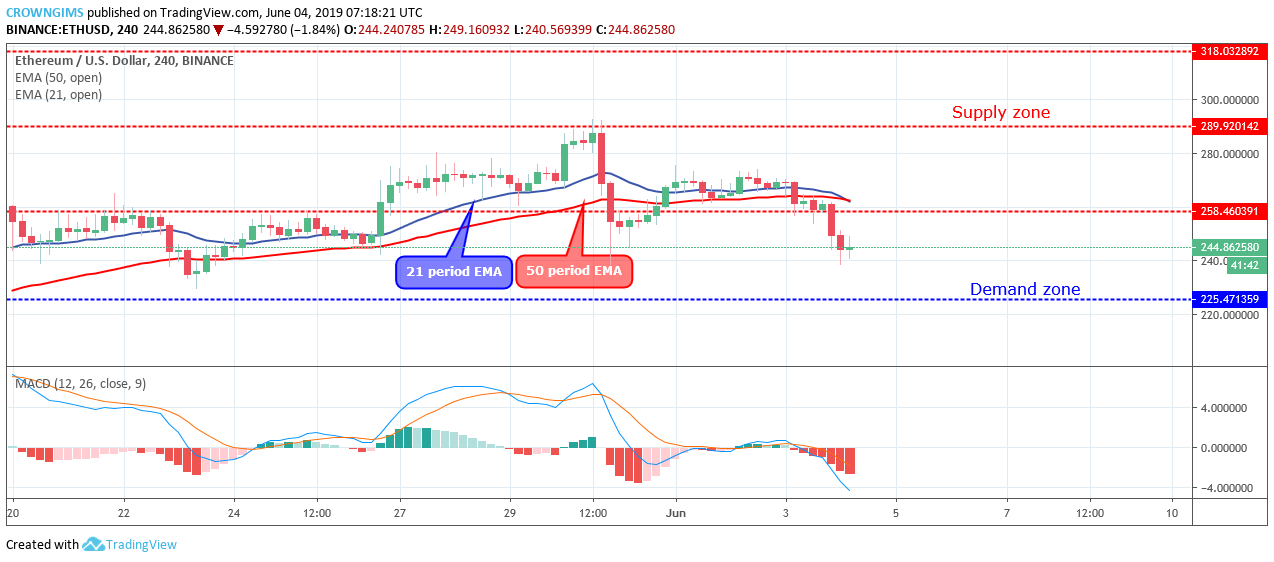
On June 03, the Bulls gave way to the Bears because they could not withstand the pressure of the Bears at $258 level, then, the strong bearish candle broke down the former demand level of $258 level and Ethereum price exposed to $225 level.

Constant high momentum from the Bears will push down Ethereum price further and it may reach the demand level of $225 provided there is no much interruption from the Bulls. In case the demand level of $225 holds the price may bounce. Ethereum is currently trading below the 21 periods EMA and 50 periods EMA, the former is trying to cross the former downside as a sign of bearish movement.

ETH/USD Short-term Trend: Bearish

On the short-term outlook, ETH price is bearish. After several days of consolidation, the coin broke out at $258 level with the aid of the Bears’ momentum; the price is decreasing towards the demand level of $225. Further decrease in Ethereum price is highly envisaged as the histogram of the Moving Average Convergence Divergence period 12 is below zero levels and the signal lines pointing down which indicates sell signal and a further decrease in price.

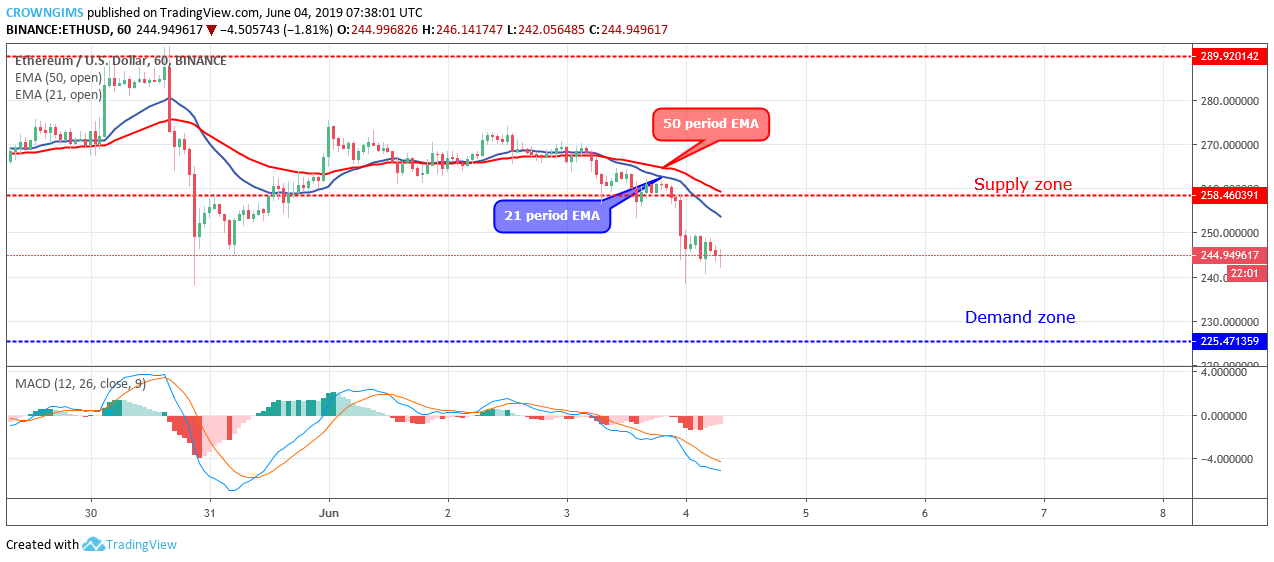
The 21 periods EMA has crossed the 50 periods EMA downside and Ethereum price is trading below the two EMAs; which indicates strong bearish momentum.

Share:

Related Articles

Whales Continue to Accumulate Ethereum, ETH Rally Ahead?

By April 23rd, 2025

Ether made a strong comeback with a 13% rally, drawing fresh whale accumulation.

Is Ethereum (ETH) Ready to Explode? Wyckoff Pattern Suggests $2,700 Breakout Ahead

By April 22nd, 2025

While ETH has struggled to reclaim market dominance, optimism is returning as crypto analyst Incognito has highlighted a classic Wyckoff accumulation pattern forming on Ethereum’s chart.

XRP Investment Products Defy Broader Crypto Market Trends

By April 22nd, 2025

XRP-based funds saw strong inflows, bucking the trend as Bitcoin and Ethereum products recorded significant outflows last week.

Exit mobile version