
In case the Bulls breakout at the upper trend line of the wedge, Ethereum price may rally towards $289 level provided the Bulls penetrate $258 level. ETH price may reverse as it has touched the upper trend line of the wedge.
Key Highlights:
- Ethereum price is still within the descending channel;
- the Bears are still in control;
- the Bulls may break out at the upper trend line.
ETH/USD Medium-term Trend: Bearish
Supply Zones: $258, $289, $318
Demand Zones: $225, $191, $102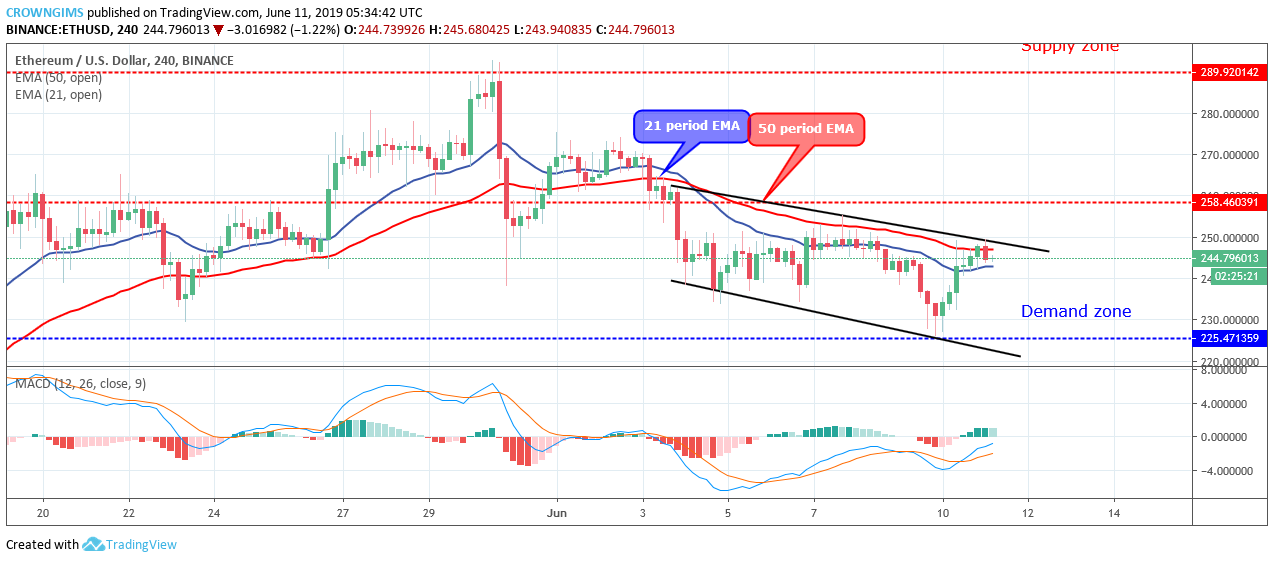

The price is almost on the same level until June 09 when the bears exerted pressure on the price and it dropped at the demand level of $225. Ethereum price bounced and then it moved up towards the supply level of $258. The Bears prevented the price to reach the mark at the dynamic support and resistance level.
Ethereum price is currently trading in between the 21 periods EMA and 50 periods EMA. The Moving Average Convergence Divergence period 12 is above the zero levels with the signal lines pointing upside which connotes buy signal.
The Bulls require a strong bullish momentum to breakout at the upper trend line of the wedge; in case this happens, the price may rally towards $289 level provided the Bulls penetrate $258 level. The price may reverse as it has touched the upper trend line of the wedge.
ETH/USD Short-term Trend: Bearish
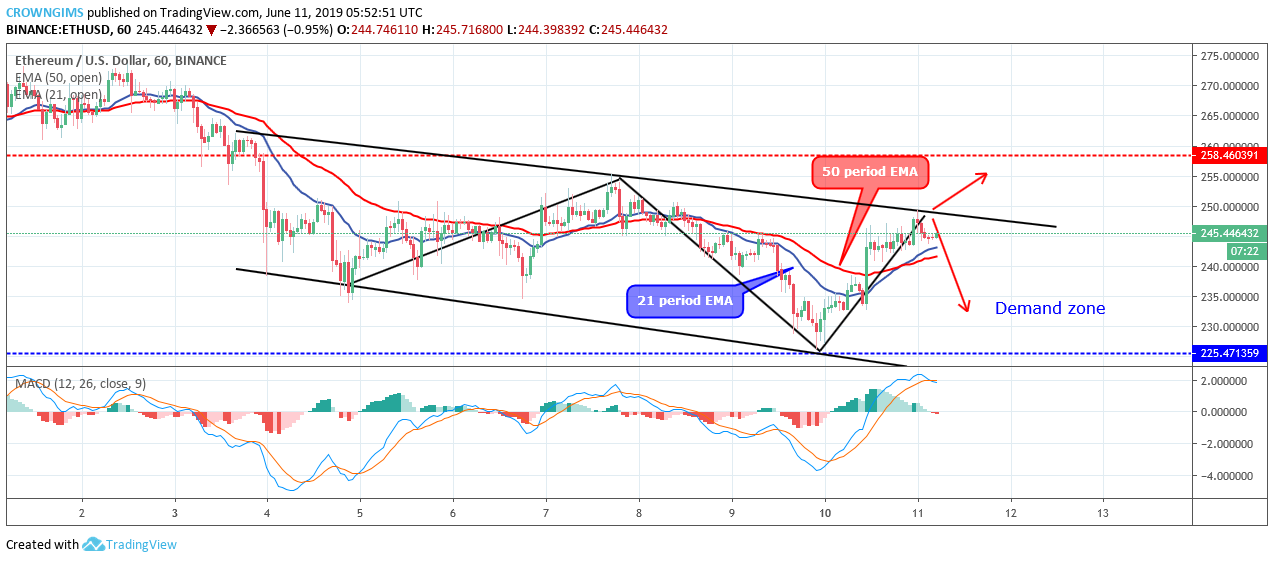
The crypto is trading above the 21 periods EMA and 50 periods EMA. The Moving Average Convergence Divergence period 12 with its histogram is gradually crossing below the zero levels and the signal lines are bending down to indicate sell signal.
next