Ethereum Price Analysis: ETH/USD is Expected to Bounce at $159

Updated on Jul 23, 2019 at 12:24 pm UTC by · 2 mins read

In case the Bears maintain or increase their pressure and $159 level does not hold, Ethereum price may decline to $150 level. Should $159 level holds, the price may bounce and the Bulls may take over.

Key Highlights:

  • The Bears are fully in control of the Ethereum market;
  • there may be a further reduction in ETH price;
  • the price may reverse at $159 price level in case the level holds.

ETH/USD Medium-term Trend: Bearish

Supply Zones: $168, $178, $186,
Demand Zones: $159, $150, $140ETH is on the bearish trend on the medium-term outlook. The Bullish momentum pushed up Ethereum price and touched $178 price level on April 20. The Bears rejected the increase in ETH price and returned the price to the demand zone of $168 where it was bounced and moved up to the previous high of $178 to form a double top chart pattern.

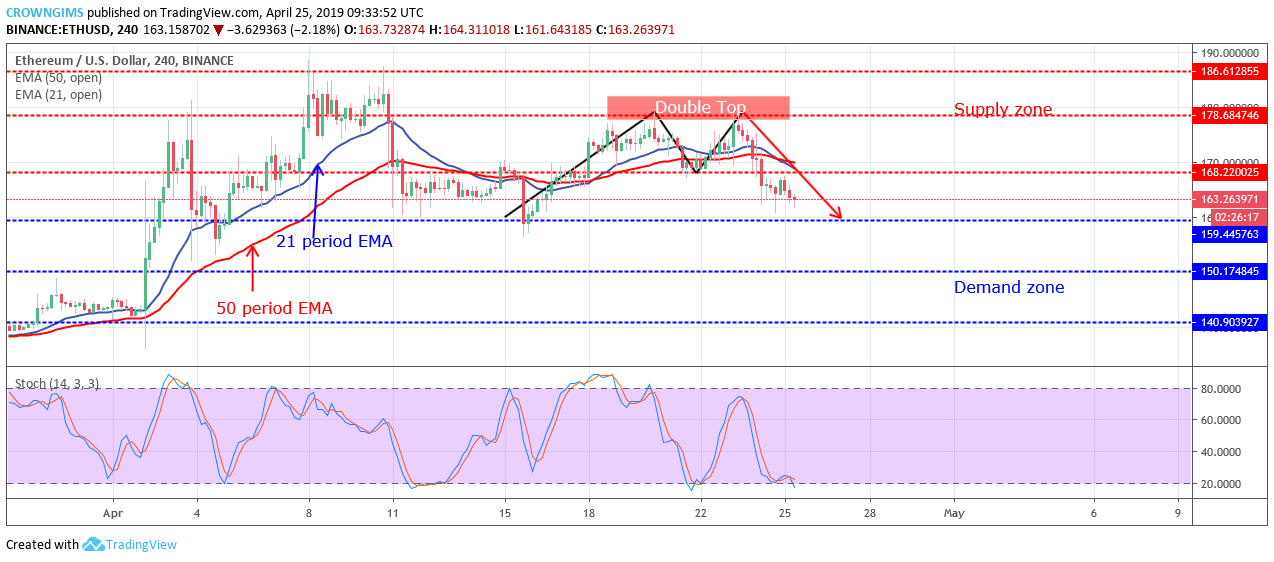
Increase in Ethereum price was opposed by the Bears second time at $178 level. The currency pair is under the Bears’ pressure, it has penetrated the barrier at $168 level and heading towards the south targeting $159 demand zone.

The 21 periods EMAs has crossed 50 periods EMA downside and the coin is trading under the two EMAs which indicate that bearish momentum is strong in the ETH market. However, the Stochastic Oscillator period 14 is at 20 levels and the signal lines pointing down to indicate a further reduction in Ethereum price.

In case the Bears maintain or increase their pressure and $159 level does not hold, ETH price may decline to $150 level. Should $159 level holds, the price may bounce and the Bulls may take over.

ETH/USD Short-term Trend: Bearish

On the short-term outlook, Ethereum price is Bearish. The double top chart pattern formed on the 1-hour chart is an indication that the bears will hold to the ETH market. The price is currently declining towards $159 level, trading under the 21 period EMA and 50 periods EMA.

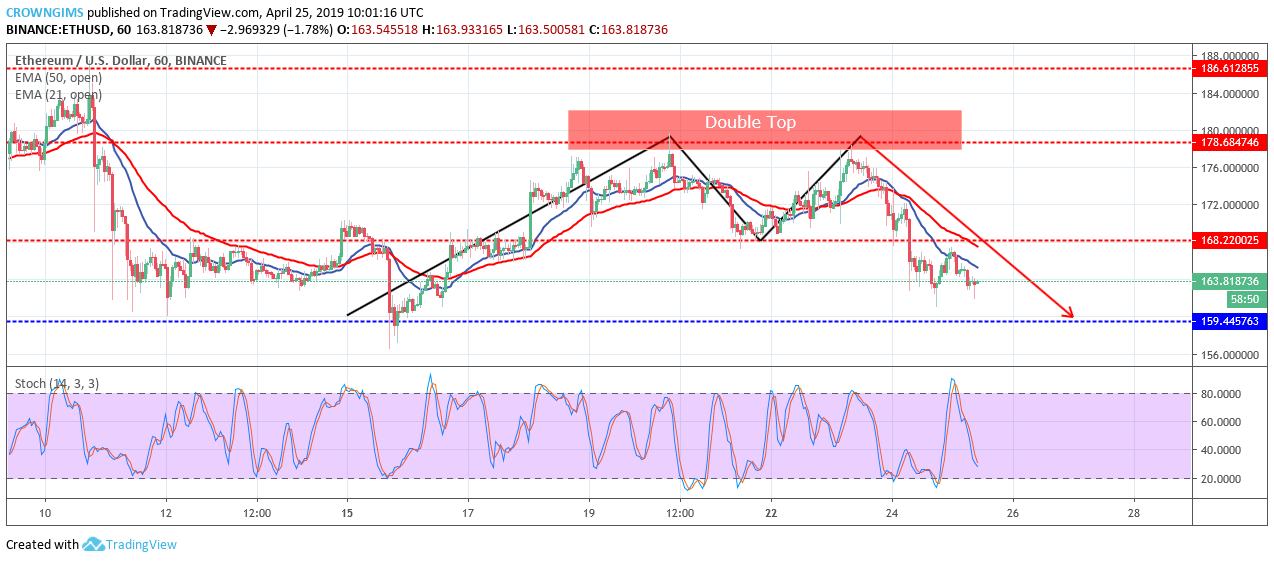
The Stochastic Oscillator period 14 is at 40 levels with the signal line bending down which connotes sell signal and a further reduction in ETH price.

Share:

Related Articles

Panama Just Flipped Bullish on Ethereum – Is a $3K ETH Breakout Next

By April 17th, 2025

In a bold step toward digital innovation, Panama City has officially embraced cryptocurrency payments for public services, including taxes, permits, tickets, and fees.

DeFi TVL Dropped by $48 Billion in Q1 Amid a Sharp Decline in Altcoin Prices

By April 17th, 2025

DeFi TVL fell by $48B in Q1 2025 as altcoins tumbled, while Bitcoin dominance rose to 59.1% amid market uncertainty and meme coin declines.

ProShares Joins Race for XRP Futures ETF, Here’s Timeline to Watch

By April 16th, 2025

ProShares has filed to launch three XRP futures ETFs, with a planned debut by April 30.

Exit mobile version