
In case the Bulls gain enough momentum to push up Ethereum price and break the upper trend line of the triangle and sustain the momentum, the ETH price may reach $149 – $161; otherwise, the bearish breakout will target $134.
Key Highlights:
- The Bulls’ momentum was lost at the $149 Ethereum price level;
- the break out from the descending triangle is imminent;
- consolidation is ongoing on the 1-hour chart.
ETH/USD Medium-term Trend: Ranging
Supply Zones: $143, $149, $161
Demand Zones: $134, $125, $113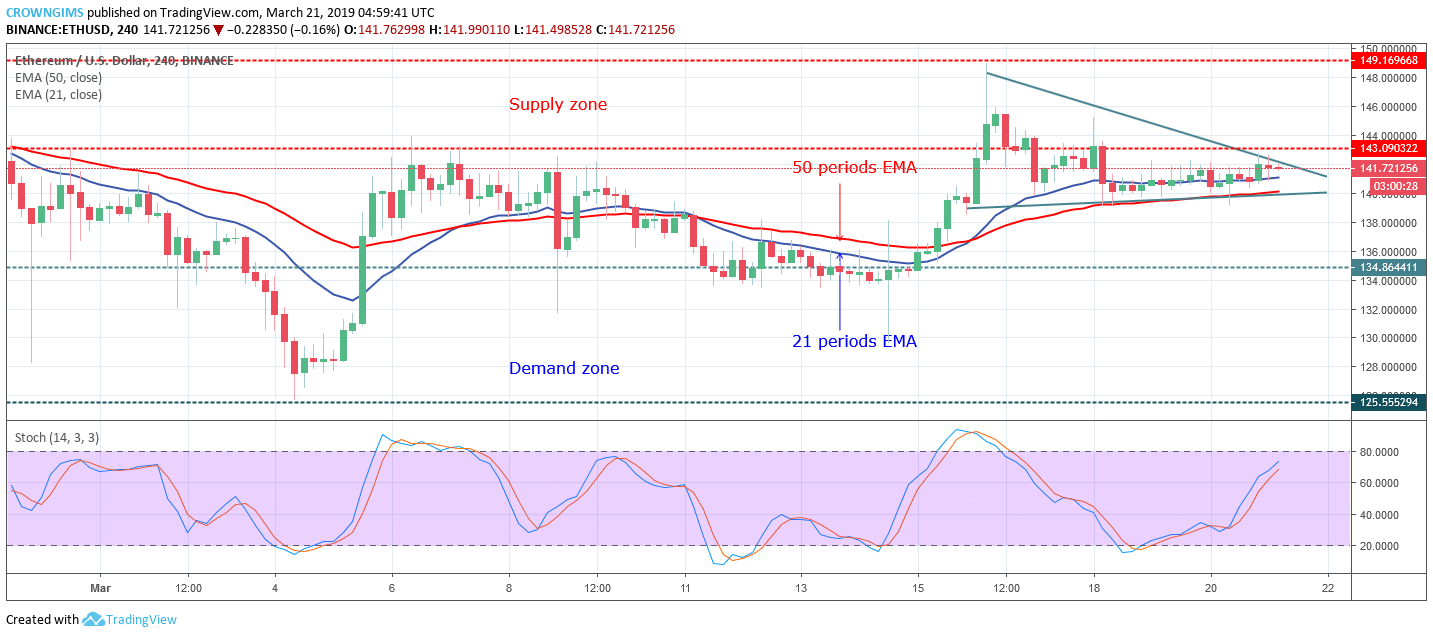

The descending triangle pattern is noticed on the 4-hour chart. Ethereum price is trading on the 21 periods, EMA and 50 periods EMA and the two EMAs close to each other confirm the consolidation in the ETH market. However, the Stochastic Oscillator period 14 is above 60 levels with the signal lines pointing up to indicate the buy signal.
In case the Bulls gain enough momentum to push up the ETH price and break the upper trend line of the triangle and sustain the momentum, Ethereum price may reach $149 – $161. Alternatively, should the $143 price level holds, there will be a bearish break out at the lower trend line of the triangle and the target will be $134.
ETH/USD Short-term Trend: Ranging
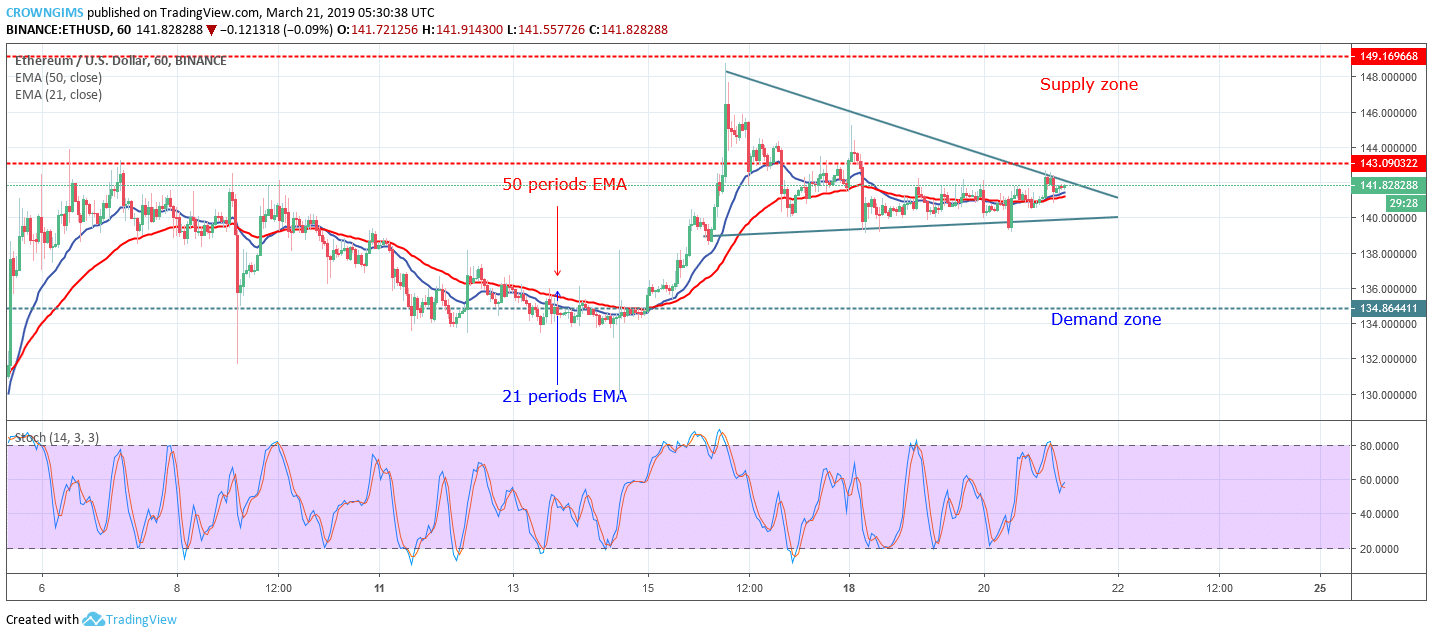
The 21 periods EMA and 50 periods EMA are interlocked to each other with the Ethereum price hovering on the EMAs. The Stochastic Oscillator period 14 is at 60 levels with the signal lines pointing down to indicate sell signal.
next