
Radical pressure is required from the bears to break down the $134 demand level; this will enable Ethereum price to find support at $125. If the $134 demand level holds and the bulls gain momentum, ETH may have the supply zone of $149 as its target.
Key Highlights:
- The Bears and the Bulls momentum are at equilibrium;
- the break out of Ethereum is imminent;
- consolidation continues at the $134 demand level.
ETH/USD Medium-term Trend: Ranging
Supply Zones: $134, $149, $161
Demand Zones: $125, $113, $101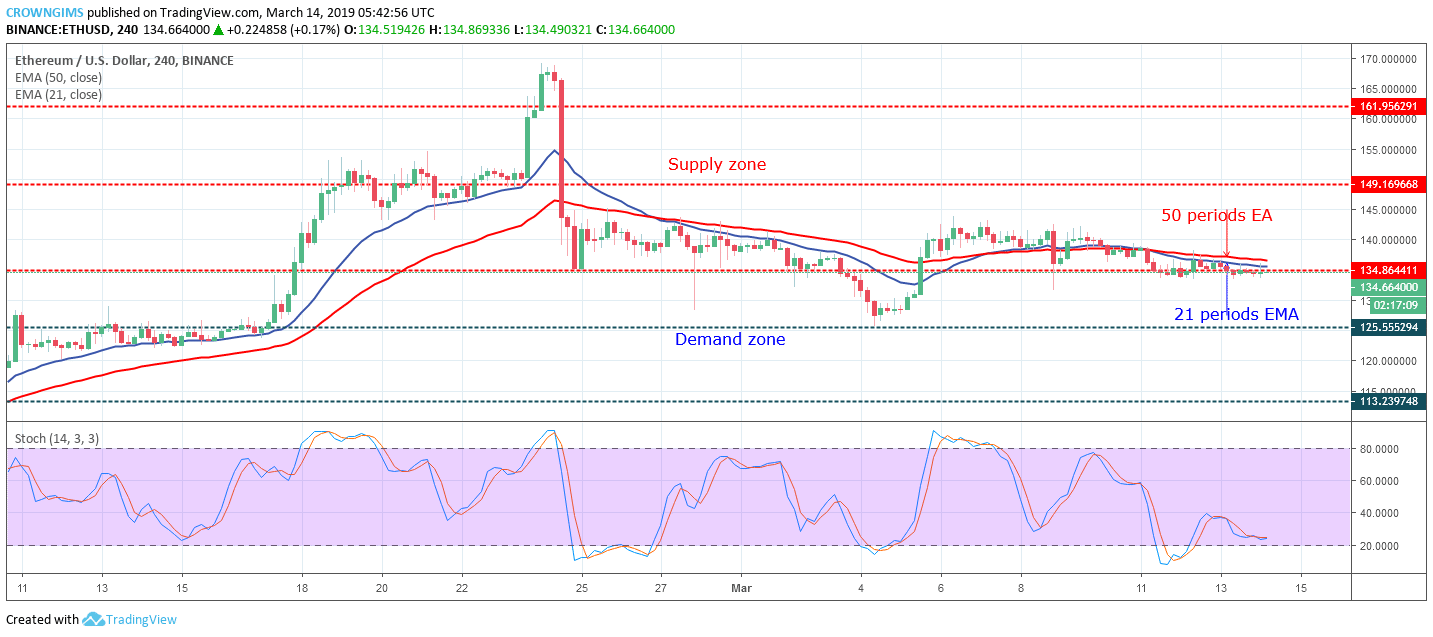

Then, ETH/USD is consolidating at $134 price level. That means the buyers and the sellers momentum are at equilibrium. Radical fundamental events may be needed to make the coin rally.
The cryptocurrency is consolidating below the 21 periods EMA and 50 periods EMA and the two EMAs are close to each other. The Stochastic Oscillator period 14 is above 20 levels horizontally flat at the level showing no direction confirm the consolidation that is ongoing in the ETH market.
Radical pressure is required from the bears to break down the significant demand level of $134 and this will enable Ethereum price to find support at $125 price level. Alternatively, In case the $134 demand level holds and the bulls gain enough momentum, the coin may have the supply zone of $149 as its target.
ETH/USD Short-term Trend: Bearish
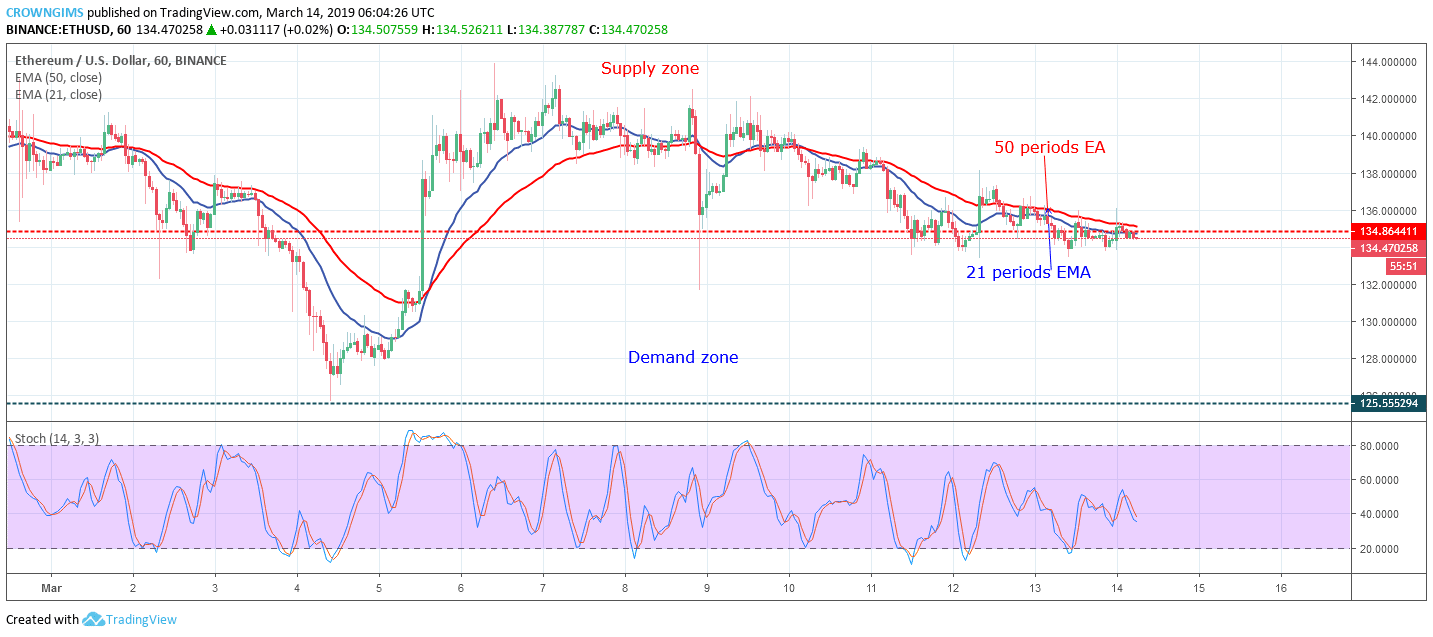
The 21 periods EMA crossed down the 30 period EMA when the bearish candle penetrated the two EMAs downside on March 8. All attempts made by the bulls to push up Ethereum price failed due to an increase in bears’ momentum. The Stochastic Oscillator period 14 is at 40 levels pointing down which connotes sell signal.
next