
Should the bulls defend the demand level of $109 and the price bounces Ethereum price will resume its uptrend movement and may have its target at the previous high of $164.
Key Highlights:
- Ethereum price may resume its bullish trend;
- the bulls rejected further ETH price declination;
- the further downtrend may target $87 price level.
ETH/USD Long-term Trend: Bearish
Supply levels: $146, $164, $187
Demand levels: $131, $109, $87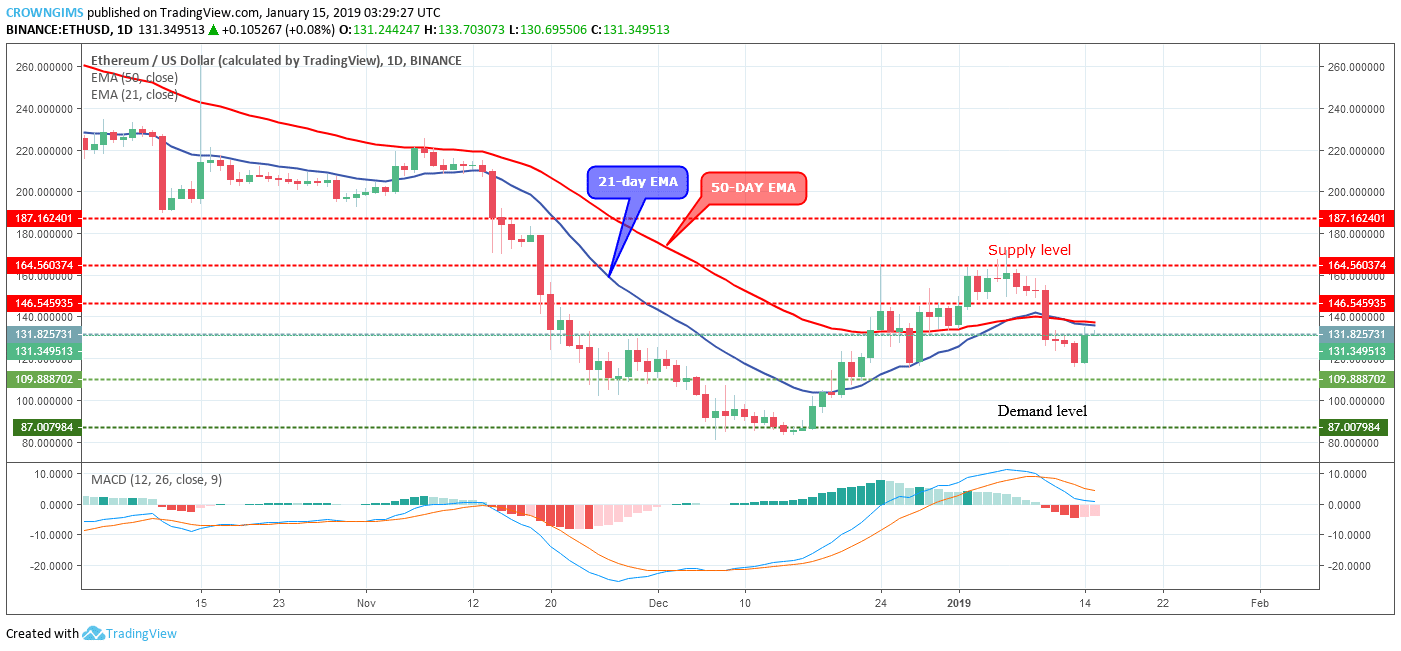

The bearish pressure pushed the coin down the market. The price levels of $146, $131 was penetrated downward and the demand level of $109 is currently exposed.
The Ethereum price is now trading below the 21-day EMA and 50-day EMA in which the two EMAs were interlocked (the 21-day EMA is crossing the 50-day EMA). Further price declination is envisaged as the MACD period 12 with its histogram is below zero levels and the signal lines pointing down.
Should the bulls defend the demand level of $109 and the price bounces ETH price will resume its uptrend movement and may have its target at the previous high of $164. Alternatively, breaking down of the demand level of $109 will land the Ethereum price at the previous low of $87 price level.
ETH/USD Medium-term Trend: Bearish
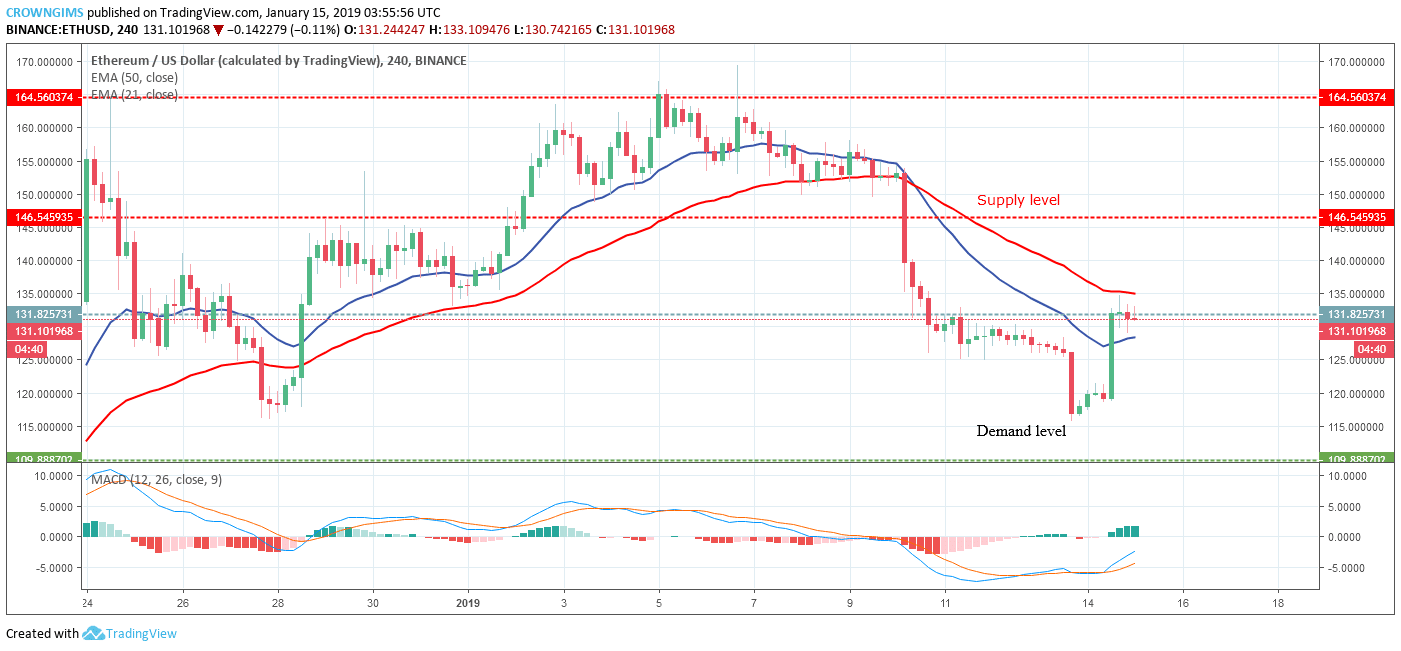
The massive bullish candle formed on January 14 indicates that the bulls are into the market with full force which may break up $131 price level and rally to the north; otherwise, it will continue its downtrend movement.
The ETH price is in-between the 21-day EMA and 50-day EMA as a signal of bullish movement. Meanwhile, the MACD period 12 with its histogram is above zero levels and the signal lines pointing up to indicate buy signal.
next