Ethereum Gas Fee Surges after Strong Inscriptions Debut on Blobs
Ethereum’s memory segments, known as “blobs”, are encountering storage issues due to excessive text or image storage, termed “Blobscriptions”. A staggering 40% of the blobs are currently occupied by inscriptions.
After the successful implementation of the Ethereum Dencun upgrade earlier this month, allowing the creation of Ethereum blobs. The blobs are similar to Bitcoin inscriptions which increase the inclusion of data within Ethereum transactions without affecting the block processing time.
However, in the recent development, Ethereum’s economical memory segments dubbed blobs are facing an issue with excessive text or image storage, commonly referred to as “Blobscriptions”. Currently, approximately 40% of blobs are occupied by such inscriptions. As a result, this introduction of blobscriptions on the Ethereum network has led to a sudden surge in the gas fee on the network.
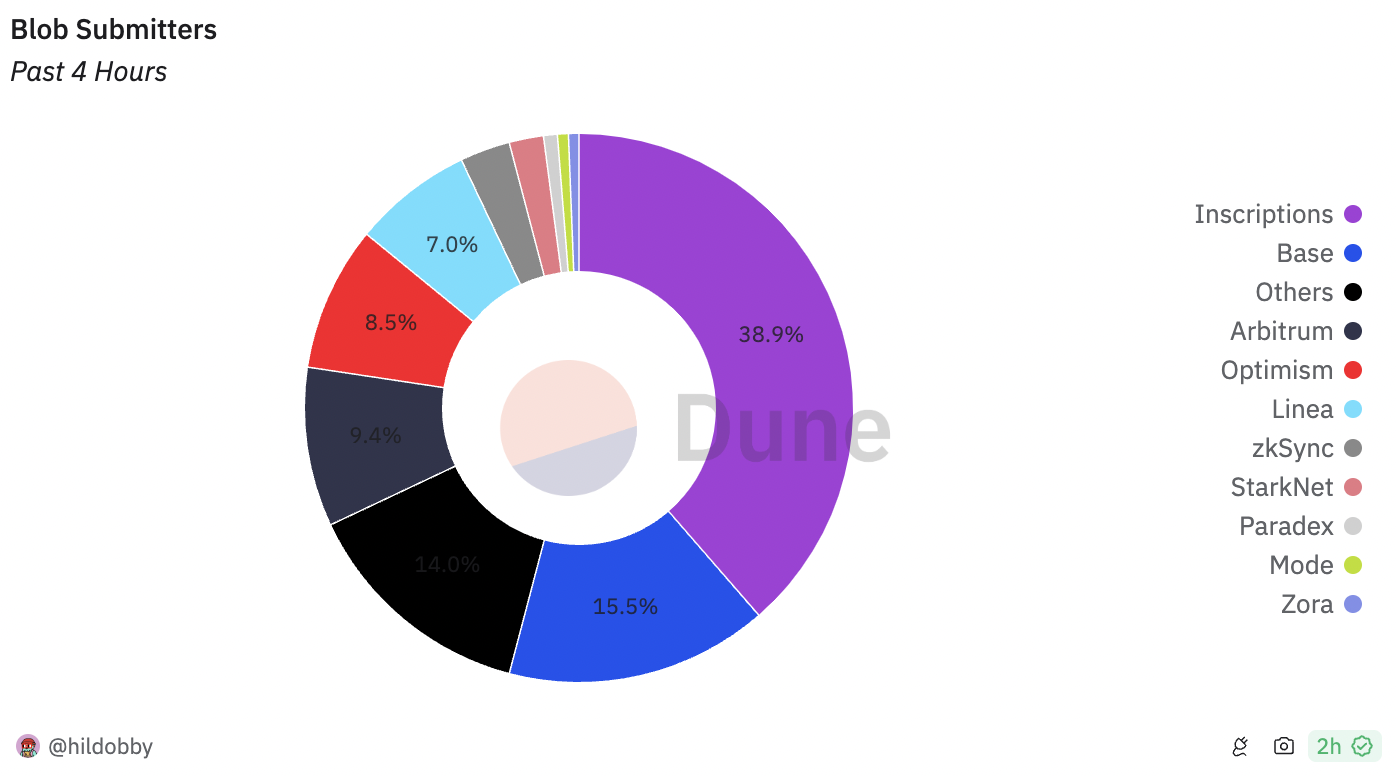
As per the data from Crypto Intelligence firm Dune Analytics, there’s been a major growth in inscriptions built atop Ethereum blobs, reaching new record levels. Over the last two days – March 27 and 28 – there’s been a major uptick in inscriptions on the Ethereum blobs.
This trend bears similarities to the surge in activity observed with Ordinals on the Bitcoin blockchain. Notably, nearly 40% of Ethereum blob submissions on Wednesday were for inscriptions.
The heightened activity in blob submissions has led to an increase in transaction fees on the Ethereum blockchain. Transaction fees surged to a peak of 586.26 Gwei on March 27, gradually declining to 25.18 Gwei by Thursday, as observed on Ultrasound.Money.
Ethereum Price Action
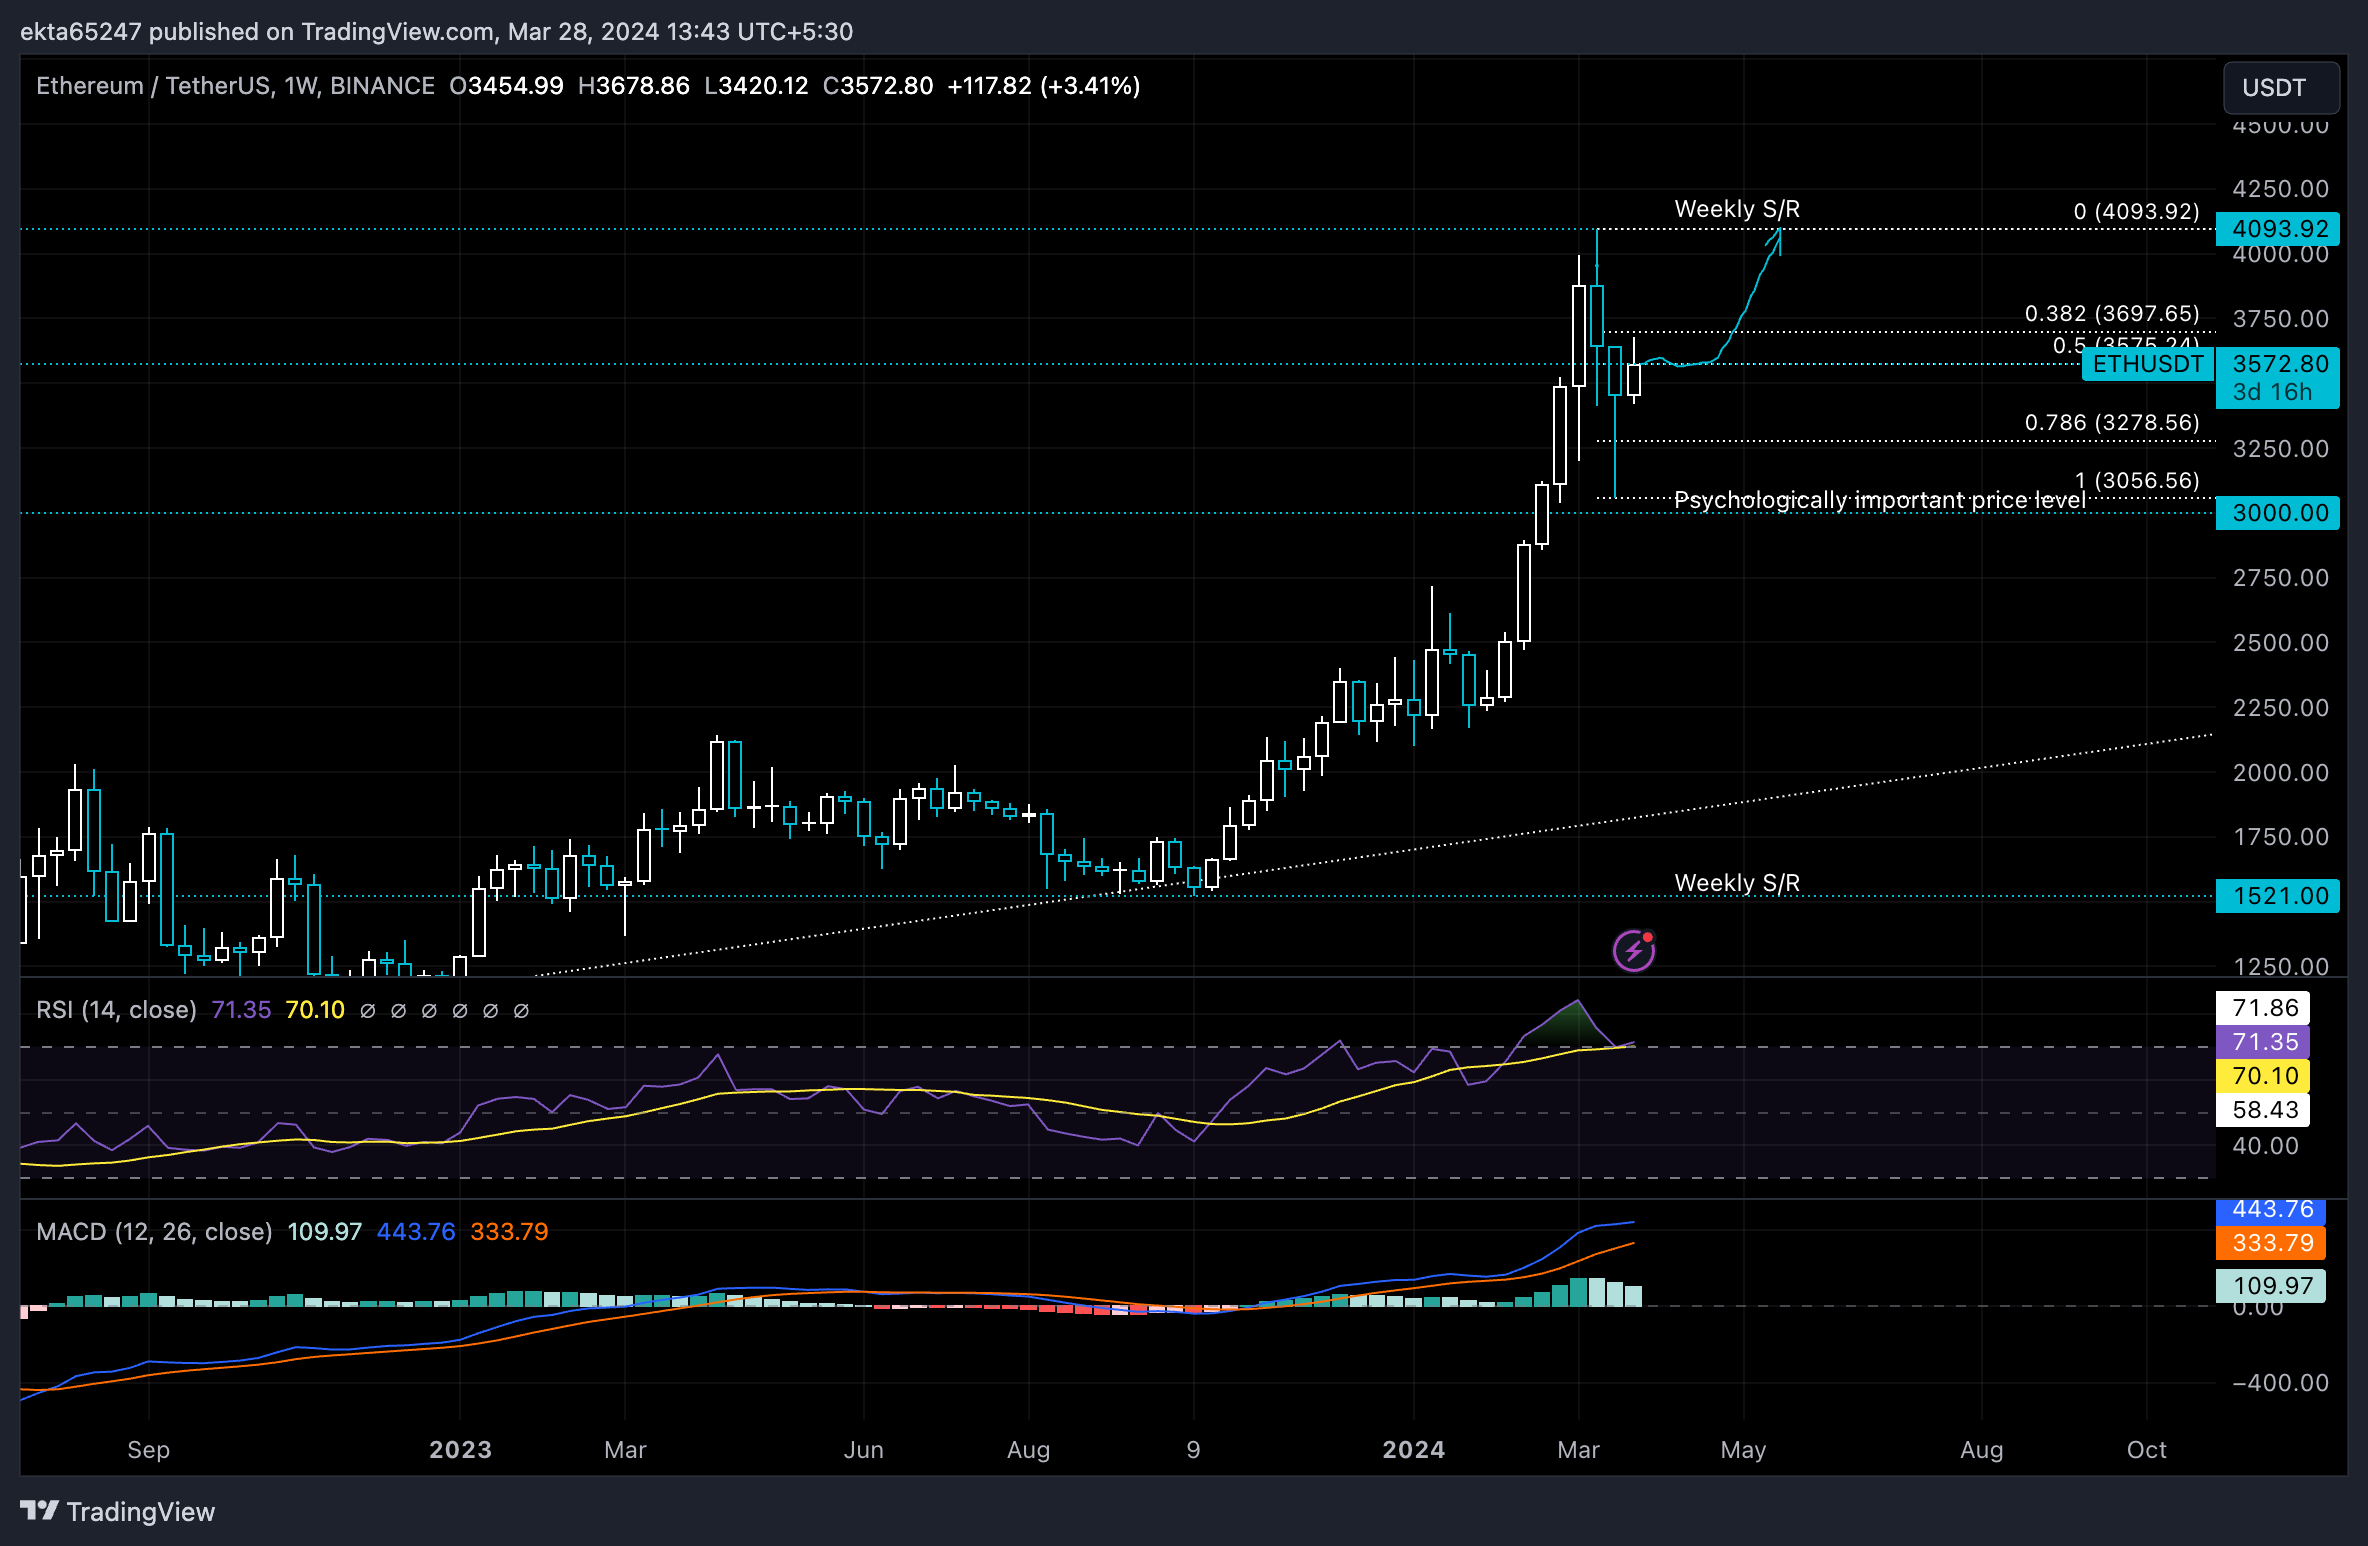
Over the past week weeks, the Ethereum price has been under some selling pressure hitting lows around $3,000 before bouncing back last week. As of press time, ETH is trading at $3,583 with a market cap of $430 billion.
Currently, ETH is testing the resistance level at $3,697, which is also the 38.2% Fibonacci placeholder derived from the decline between the March 11 peak of $4,093 and the March 18 low of $3,056.
Moreover, the Relative Strength Index (RSI) indicates sell signals in the overbought zone above 70. However, the presence of green bars above the zero line in the Moving Average Convergence/Divergence (MACD) still supports a bullish outlook for Ether. There is a greater likelihood that Ethereum’s price will resume its upward trajectory towards the weekly resistance level and later to $4,093.92.
For Ethereum to sustain its rally towards the year-to-date (YTD) target, it is crucial for the altcoin to convert the resistance level at $3,697 into support.
Photo: CryptoFXStreet
If there is a daily candlestick closure below the support level at $3,278, which corresponds to the 78.6% Fibonacci placeholder, it could potentially invalidate the bullish thesis. In this case, the price of ETH might decline to test the March 18 low of $3,056.
Disclaimer: Coinspeaker is committed to providing unbiased and transparent reporting. This article aims to deliver accurate and timely information but should not be taken as financial or investment advice. Since market conditions can change rapidly, we encourage you to verify information on your own and consult with a professional before making any decisions based on this content.
Bhushan is a FinTech enthusiast and holds a good flair in understanding financial markets. His interest in economics and finance draw his attention towards the new emerging Blockchain Technology and Cryptocurrency markets. He is continuously in a learning process and keeps himself motivated by sharing his acquired knowledge. In free time he reads thriller fictions novels and sometimes explore his culinary skills.