EOS/USD Price Analysis: Trends of August 20th–26th, 2018
EOS daily chart made its downward movement to the price level of $4.1 and bounced up towards the resistance level of $5.0, suggesting that there could be a form of a bullish reversal this week.
There is a probability of the bullish trend reversal;
consolidation pattern is currently confirmed;
traders should be patient for a break out at the resistance level or support level before taking a position.
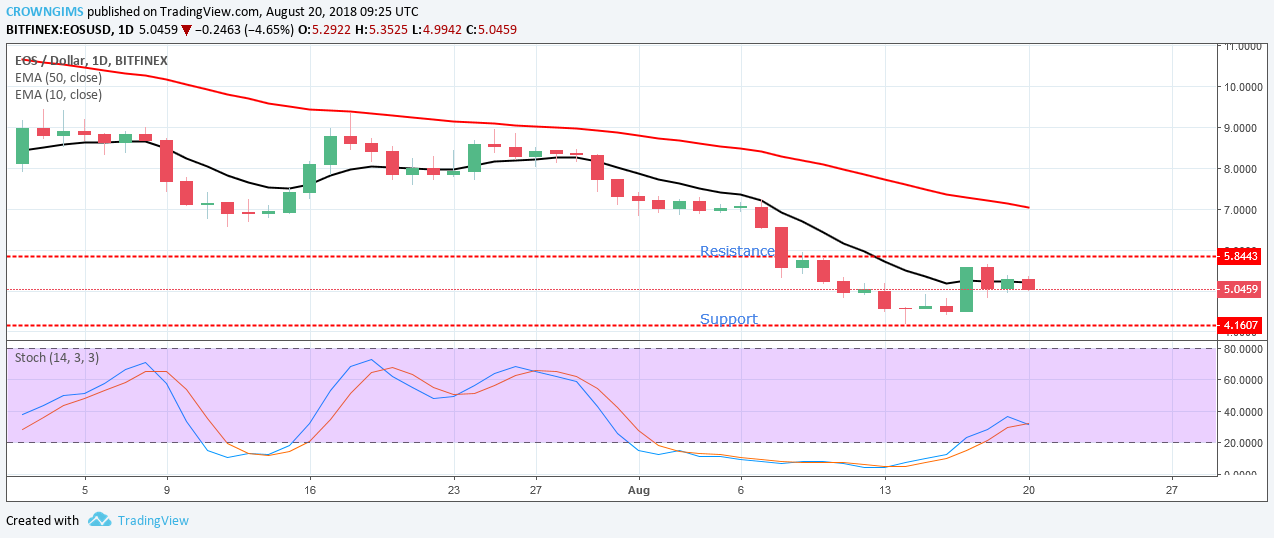
EOSUSD Long-term Trend: Bearish
Resistance levels: $5.0, $7.0, $9.0
Support levels: $4.1, $2.0, $0.5
The cryptocurrency, last week on the daily chart made its downward movement to the price level of $4.1 and bounced up towards the resistance level of $5.0. The support level of $4.1 was reached on the 18th of March, 2018, before the trend changed from downward to upward.
The formation of a strong bullish candle at the level of $4.1 suggesting that there could be a form of a bullish reversal this week. The Stochastic Oscillator period 14 is above the level 30, with signal lines pointing upward, indicates that the market may be headed towards north.
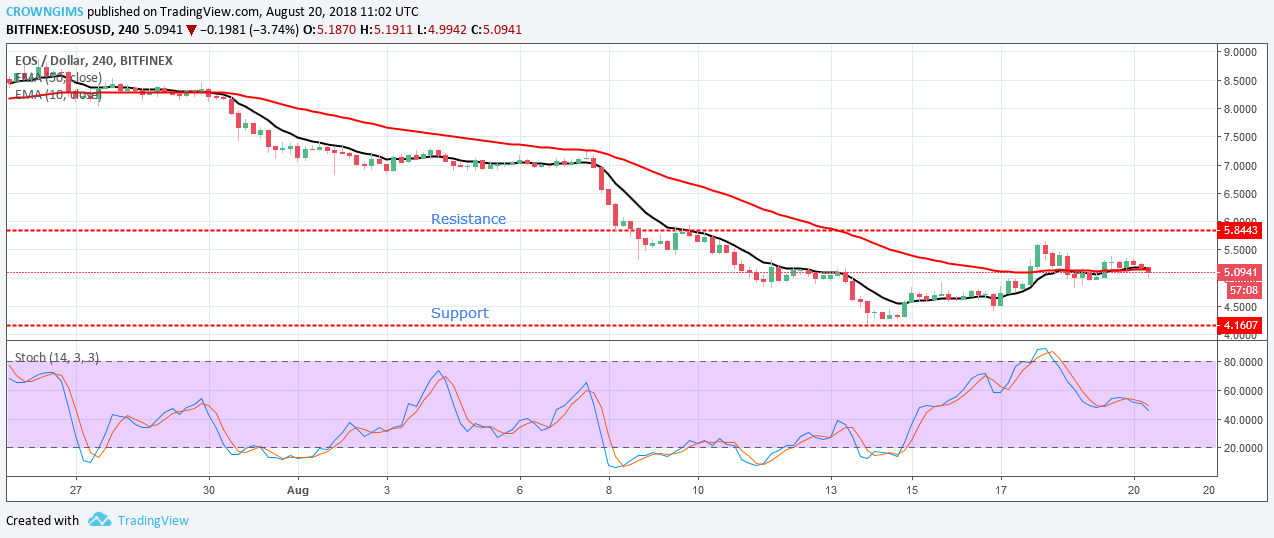
EOSUSD Price Medium-term Trend: Bearish
There was a continuation of downward movement after the price retracement to the resistance level of $5.0. The 10-day EMA moved farther away from 50-day EMA, and the price reached the support level of $4.0 where it bounced back upward towards the resistance level of $5.0.
This week, the price started consolidation after upward movement towards the resistance level of $5.0. Should EOS price go up and break the resistance level at $5.0 and produce a medium-term bullish candle, then an upward movement could be anticipated, which would result in a bullish signal.
EOS is currently hovering within the resistance level of $5.0 and the support level of $4.1. This is a short-term ranging movement, which may change soon. Should the support level of $4.1 get broken with the formation of a strong bearish candle, the price will be exposed to the support level of $2.0. as the Stochastic Oscillator period 14 is below 50 with signal lines pointing downward. Traders should be patient for a break out at the resistance level or support level before taking a position.
Azeez Mustapha is a specialist in Computer Studies (including DTP), Forex and Crypto trading professional. Being expert technical and currency analyst, as well as experienced fund manager and author of several books, Azeez places strong focus on crypto market studies conducting comprehensive price analyses and sharing forecasts of presumptive market trends.

 The cryptocurrency, last week on the daily chart made its downward movement to the price level of $4.1 and bounced up towards the resistance level of $5.0. The support level of $4.1 was reached on the 18th of March, 2018, before the trend changed from downward to upward.
 EOSUSD Price Medium-term Trend: Bearish