
The price has formed a “pennant” pattern on the daily chart which suggests the probability for the price to fall toward support level of $4.1.
Key Highlights
- Formation of “Pennant” pattern confirmed on the daily and 4H chart;
- the price might go down this week;
- traders should take position patiently.
EOS/USD Long-term Trend: Bullish
Resistance levels: $6.8, $9.4, $11.4
Support levels: $4.1, $2.0, $0.5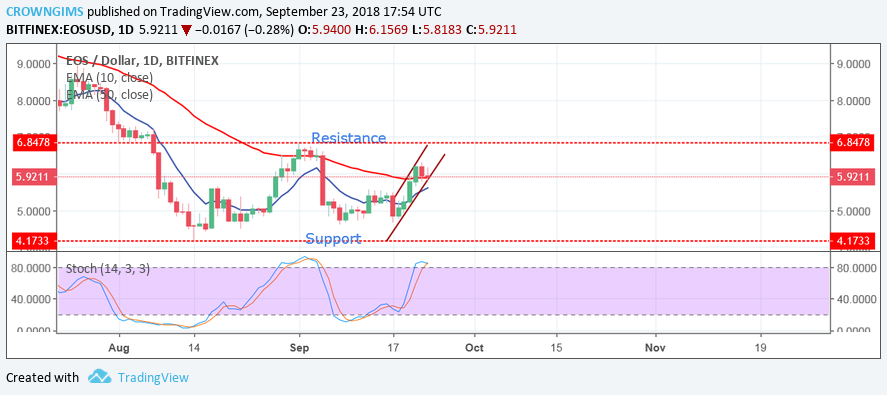

As at present the price has formed a “pennant” pattern on the daily chart which suggests the probability for the price to fall toward support level of $4.1. In case the bulls increase their pressure the price will rise towards the resistance level of $6.8. The Stochastic Oscillator Period 14 on the daily chart is above the level 80 (oversold level), with its signal lines pointing downwards, which indicates the probability of a bearish movement this week.
EOS/USD Price Medium-term Trend: Bullish
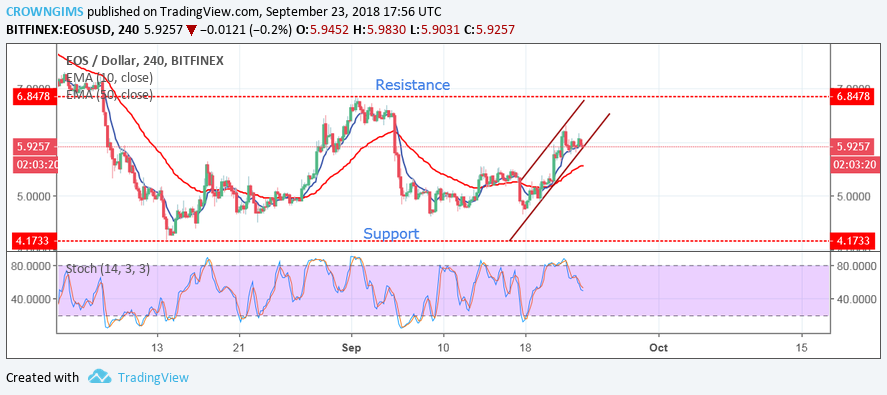
The Stochastic Oscillator Period 14 on the 4-hour chart is below 50 levels with its signal lines pointing towards the south suggesting a decrease in price which may be temporary. Traders should take position patiently.
next