EOS/USD Price Analysis: Trends of August 27–September 2, 2018
On
Aug 27, 2018 at 12:41 pm UTC
by Azeez Mustapha · 2 mins read
There is a strong possibility that price might go up this week by making a break out towards the North, but confirmation needed to long.
Key Highlights:
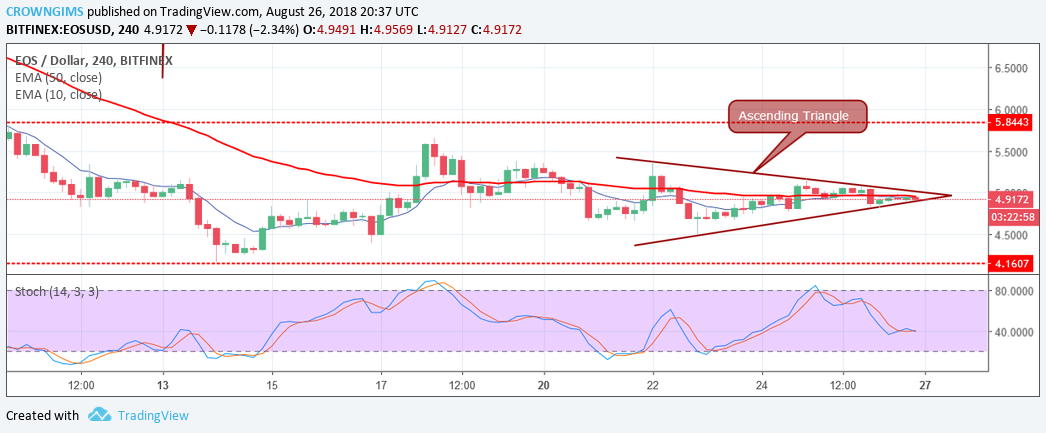
There is an ascending triangle Pattern confirmation in the EOS 4-Hour chart;
the price might go up this week;
traders are to wait for confirmation before taking a long position.
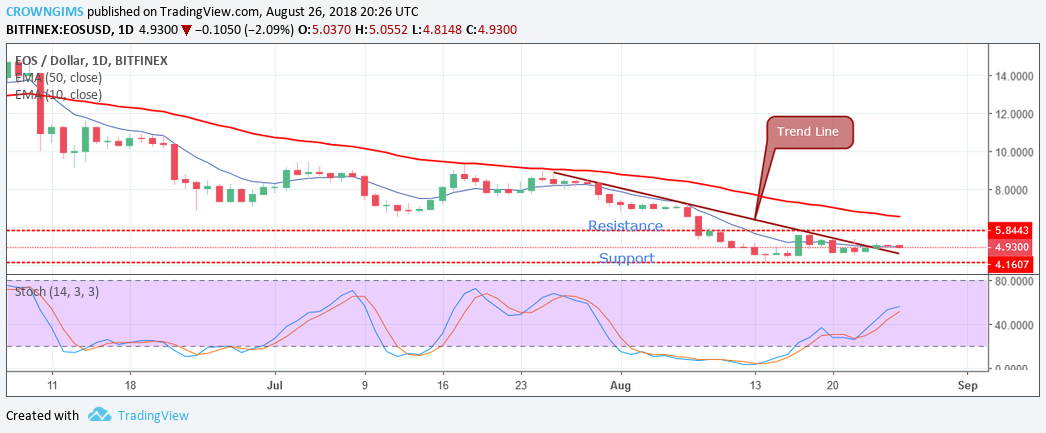
EOS/USD Long-term Trend: Bearish
Resistance levels: $5.8, $7.4, $9.4
Support levels: $4.1, $2.0, $0.5The formation of a strong bullish candle at the level of $4.1 on the daily chart of EOS/USD last week could not break the resistance level of $5.8, which was suggested could be a form of a bullish reversal. More sellers came in and push the price down. EOS/USD has kept making lower lows on the daily charts. Last week was also bearish, there is a strong possibility that price might go up this week by making a break out towards the North. On the daily chart, the Stochastic Oscillator Period 14 is above the level 40, with its signal line pointing towards North, which indicates there could be a form of bullish reversal, especially temporarily when the price breaks out above the resistance level of $5.8.
EOS/USD Price Medium-term Trend: Bearish
EOS/USD is also bearish in the 4H-chart. The price has been moving within the ascending triangle which is suggesting the bullish breakout. As of this week, the price is consolidating, thus creating an equilibrium phase. The 10-day EMA is interlocked with 50-day EMA, confirming consolidation. Should EOS price go up to the resistance level at $5.8 and produce a bullish engulfing candle, then a breakout towards the upside could be anticipated, which would result in an uptrend movement.
Looking at the support and resistance levels, the price is currently hovering within the boundaries of the resistance level at $5.8 and the support level at $4.1. As the current position of the Stochastic Oscillator suggests, a rise in momentum is foreseen but confirmation needed to long.
EOS price will sink to the lows of $4.6 if the bears break down the support level of $5.2, also a bullish breakout will ensure that the resistance level at $6.0 is broken before EOS price will rally to the resistance level of $6.5.
A bullish breakout will ensure that the resistance level at $6.0 is broken then the EOS price will rally to the level of $6.5 which is the upper resistance level of price.
Before EOS can return to its uptrend movement, the bulls will have to increase their momentum, push the EOS price above the resistance level of $6.3 and sustain it.