According to the data by CoinMarketCap, ENJ’s market cap briefly climbed above $200 million, lifting the token nearly 80 spots on the global crypto leaderboard.
The driving force behind the explosive move appears to be the recent launch of Enjin’s newly launched NFT Software Development Kit (SDK). The product enables developers to easily embed NFTs into gaming environments and other applications.
📈 $ENJ surges 33% to $0.0903 as traders spot fresh momentum, point to key reasons behind the pump:
Additionally, the recent integration of the Efinity parachain into the Polkadot ecosystem has also improved Enjin’s scalability. The blockchain is now more equipped to support real-time gaming economies and large-scale NFT deployments.
ENJ Price Outlook
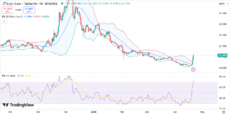
Notably, since December 2024, ENJ was trading within a downward parallel channel. On Sunday, the price move suddenly flipped as ENJ punched through both the upper trendline and a crucial horizontal resistance. Two strong green candles on the daily chart marked this breakout.
$ENJ is trading at $0.0901, reflecting a 34.99% increase over the past 24 hours, with a trading volume of $200.62 million and a market capitalization of $161.12 million. This surge is attributed to several factors: the launch of the Enjin NFT SDK, enabling seamless integration of…
X analysts are now eyeing the $0.32 level as the next target—a potential 300% surge from current levels.
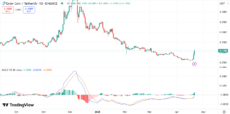
On the daily ENJ price chart, the MACD has just printed a bullish crossover, with histogram bars flipping green. This is typically an early confirmation of a sustained uptrend.
ENJ price chart | Source: TradingView
Meanwhile, the RSI is sitting at 72.94, signaling overbought conditions. While this could suggest a short-term pullback, in strong rallies, the RSI often remains elevated for extended periods.
ENJ price chart | Source: TradingView
Bollinger Bands are widening, with ENJ closing above the upper band, which acts as a dynamic resistance level (currently near $0.0916).
On the other hand, if the token takes a downward direction and fails to maintain above the middle band (20-day SMA), traders could see short-term pullbacks.
Enjin’s rally aligns with a broader rally in gaming utility tokens, which have gained 7.67% over the past 24 hours.
Disclaimer: Coinspeaker is committed to providing unbiased and transparent reporting. This article aims to deliver accurate and timely information but should not be taken as financial or investment advice. Since market conditions can change rapidly, we encourage you to verify information on your own and consult with a professional before making any decisions based on this content.
A crypto journalist with over 5 years of experience in the industry, Parth has worked with major media outlets in the crypto and finance world, gathering experience and expertise in the space after surviving bear and bull markets over the years. Parth is also an author of 4 self-published books.