Compound (COMP) token shot up more than 10% in the past 24 hours, trading at a price tag of $56.46.
The cryptocurrency sits just above the critical $56 support level and has formed an Adam & Eve pattern.
An attempt to reclaim the 20-day EMA at $60.82 could be seen in the near future before attempting higher prices.
The prominent digital asset Compound COMP$42.0424h volatility:4.6%Market cap:$376.29 MVol. 24h:$28.36 M
has failed to produce significant gains for its users during this rally. However, the altcoin might be getting a major bullish break in the near future. Popular crypto analyst Ali Martinez recently noted on X (formerly Twitter) that COMP is showing signs of a breakout from the Adam & Eve pattern—a bullish technical structure. Martinez noted that as long as the $56 support level holds, COMP could potentially target $73 in the near term.
#Compound$COMP appears to be breaking out of an Adam & Eve pattern, with a potential target of $73, as long as the $56 support level holds! pic.twitter.com/GIzSOAlzJy
At the time of writing, Compound trades at $58.46 following a 10.5% rise in the token’s price within the last 24 hours. Market capitalization has also seen a 10% uptick, reaching around $517 million, according to Coinspeaker data. It is also important to mention that COMP trades at a 93.55% discount to its all-time high of $911.20.
COMP Price Analysis
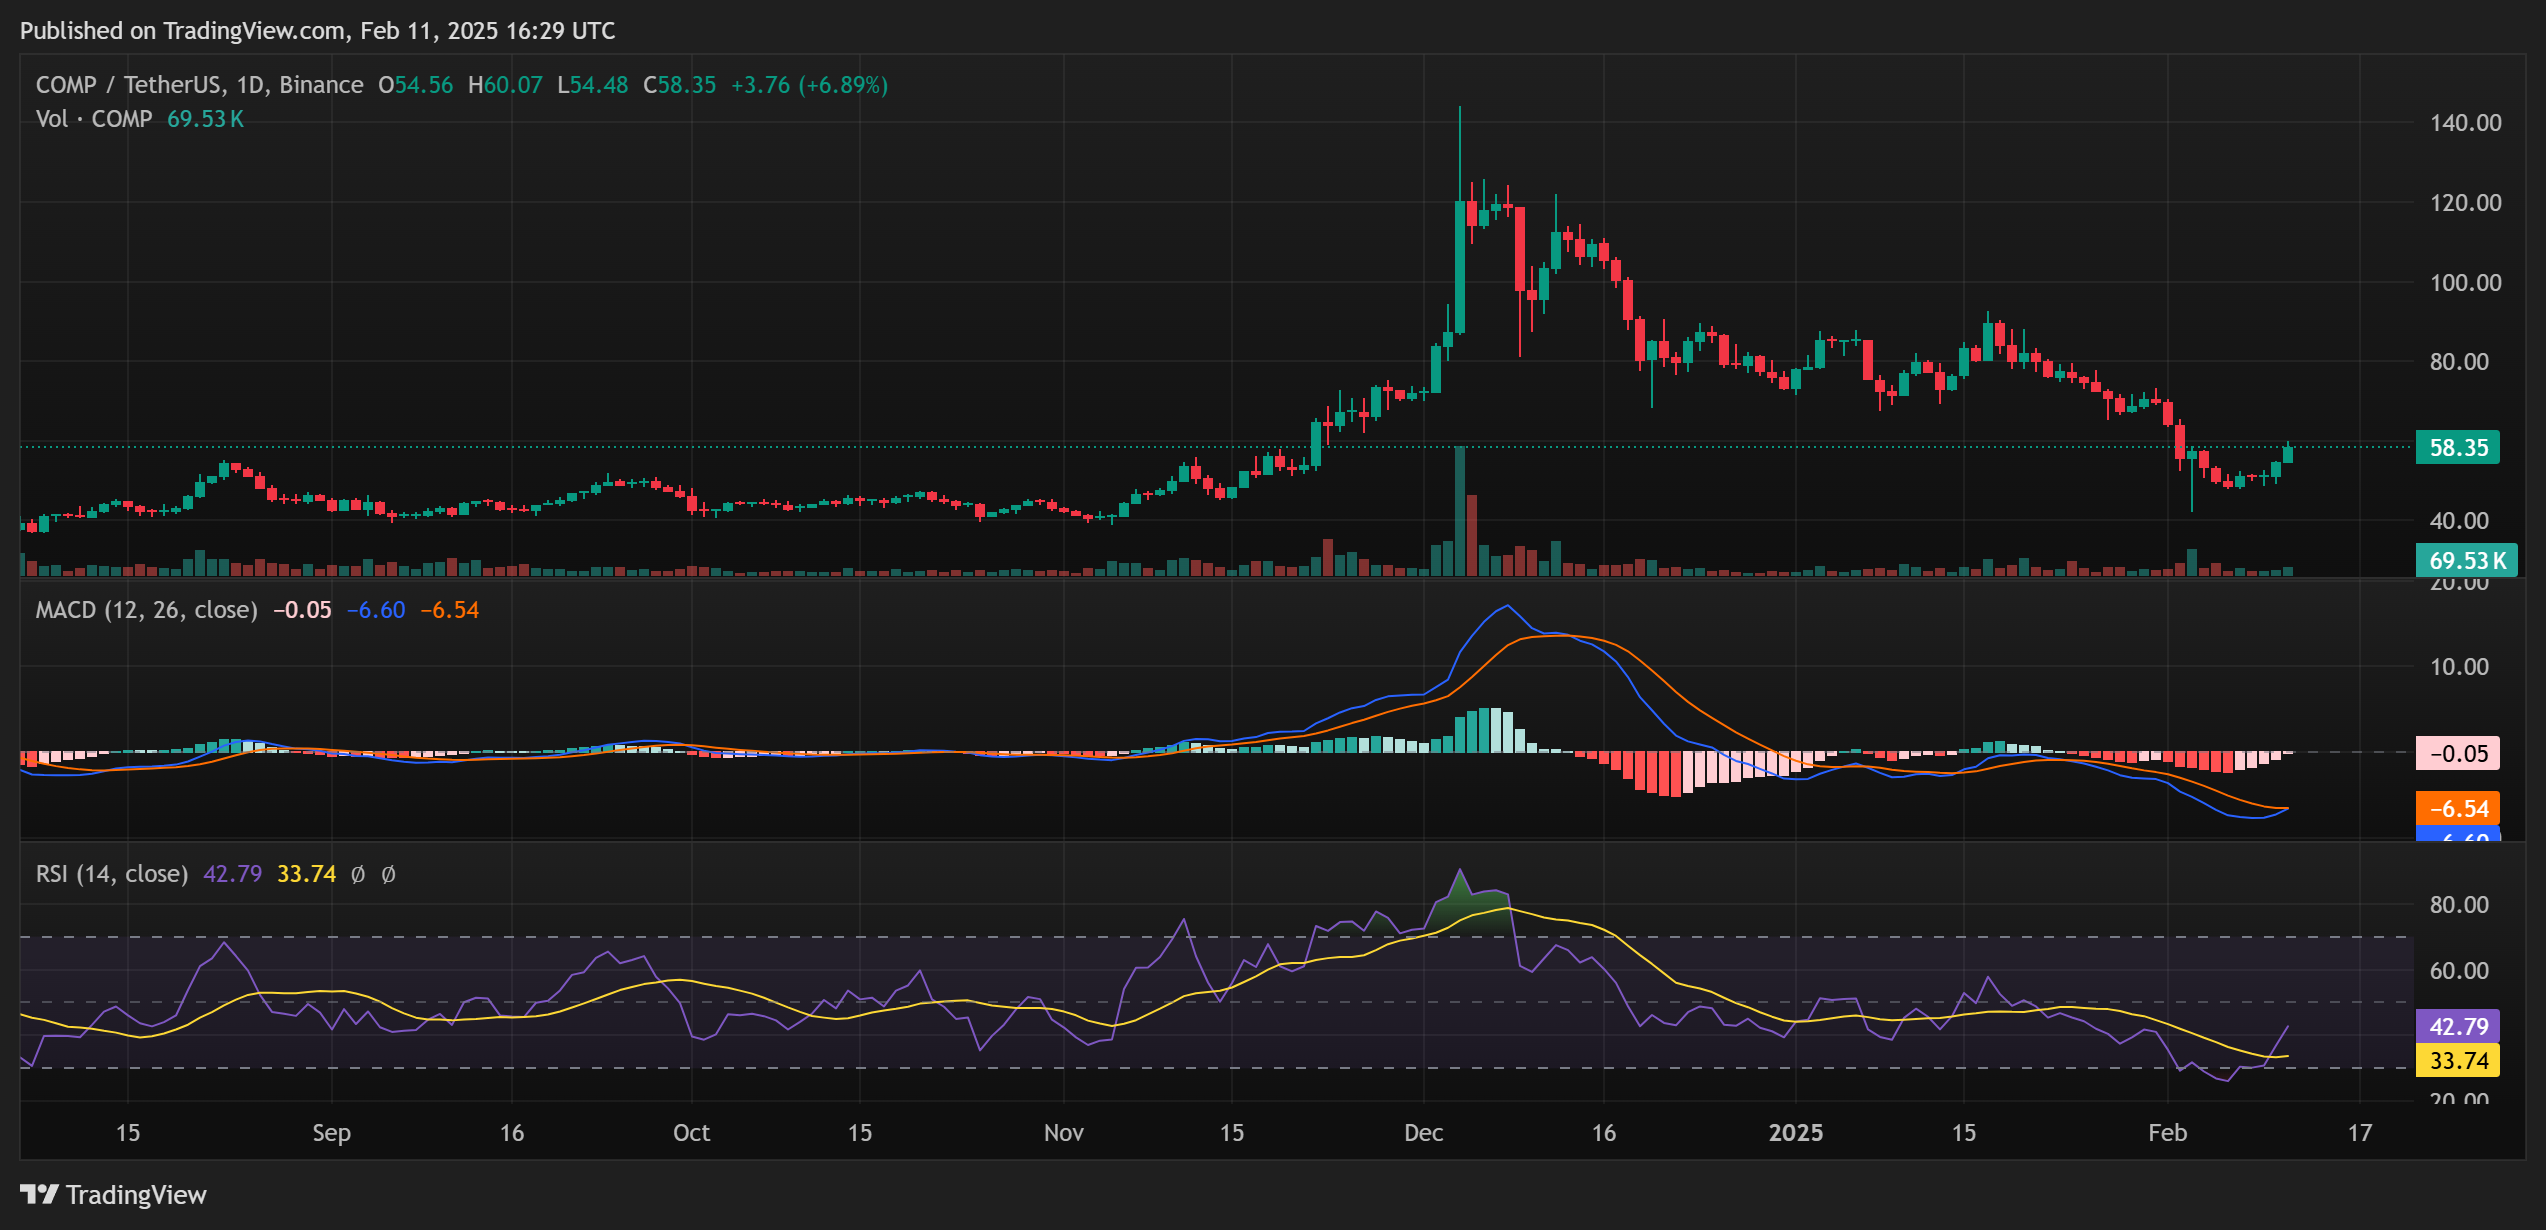
On the daily chart, COMP price sits just above the critical $56 support level, which has proven resilient during recent market dips. The Moving Average Convergence Divergence (MACD) has almost confirmed a bullish crossover, with the MACD line (blue) touching the signal line (signal), which often signals a shift toward positive momentum. Additionally, the histogram is showing diminishing red bars, another bullish indicator.
Source: TradingView
Meanwhile, the Relative Strength Index (RSI) stands at 42.79, which means that the bears are gradually losing their grip on the COMP price action. Traders can use this analysis to time an entry into the Compound price action. The gradient of the RSI line suggests a spike in the Compound token’s demand and a potential attempt to reclaim the 20-day exponential moving average (EMA) which sits at $60.82.
If the bulls successfully reclaim the 20-day EMA, investors can expect $100 in the near future for the COMP price action, finally breaking the bearish streak of the altcoin.
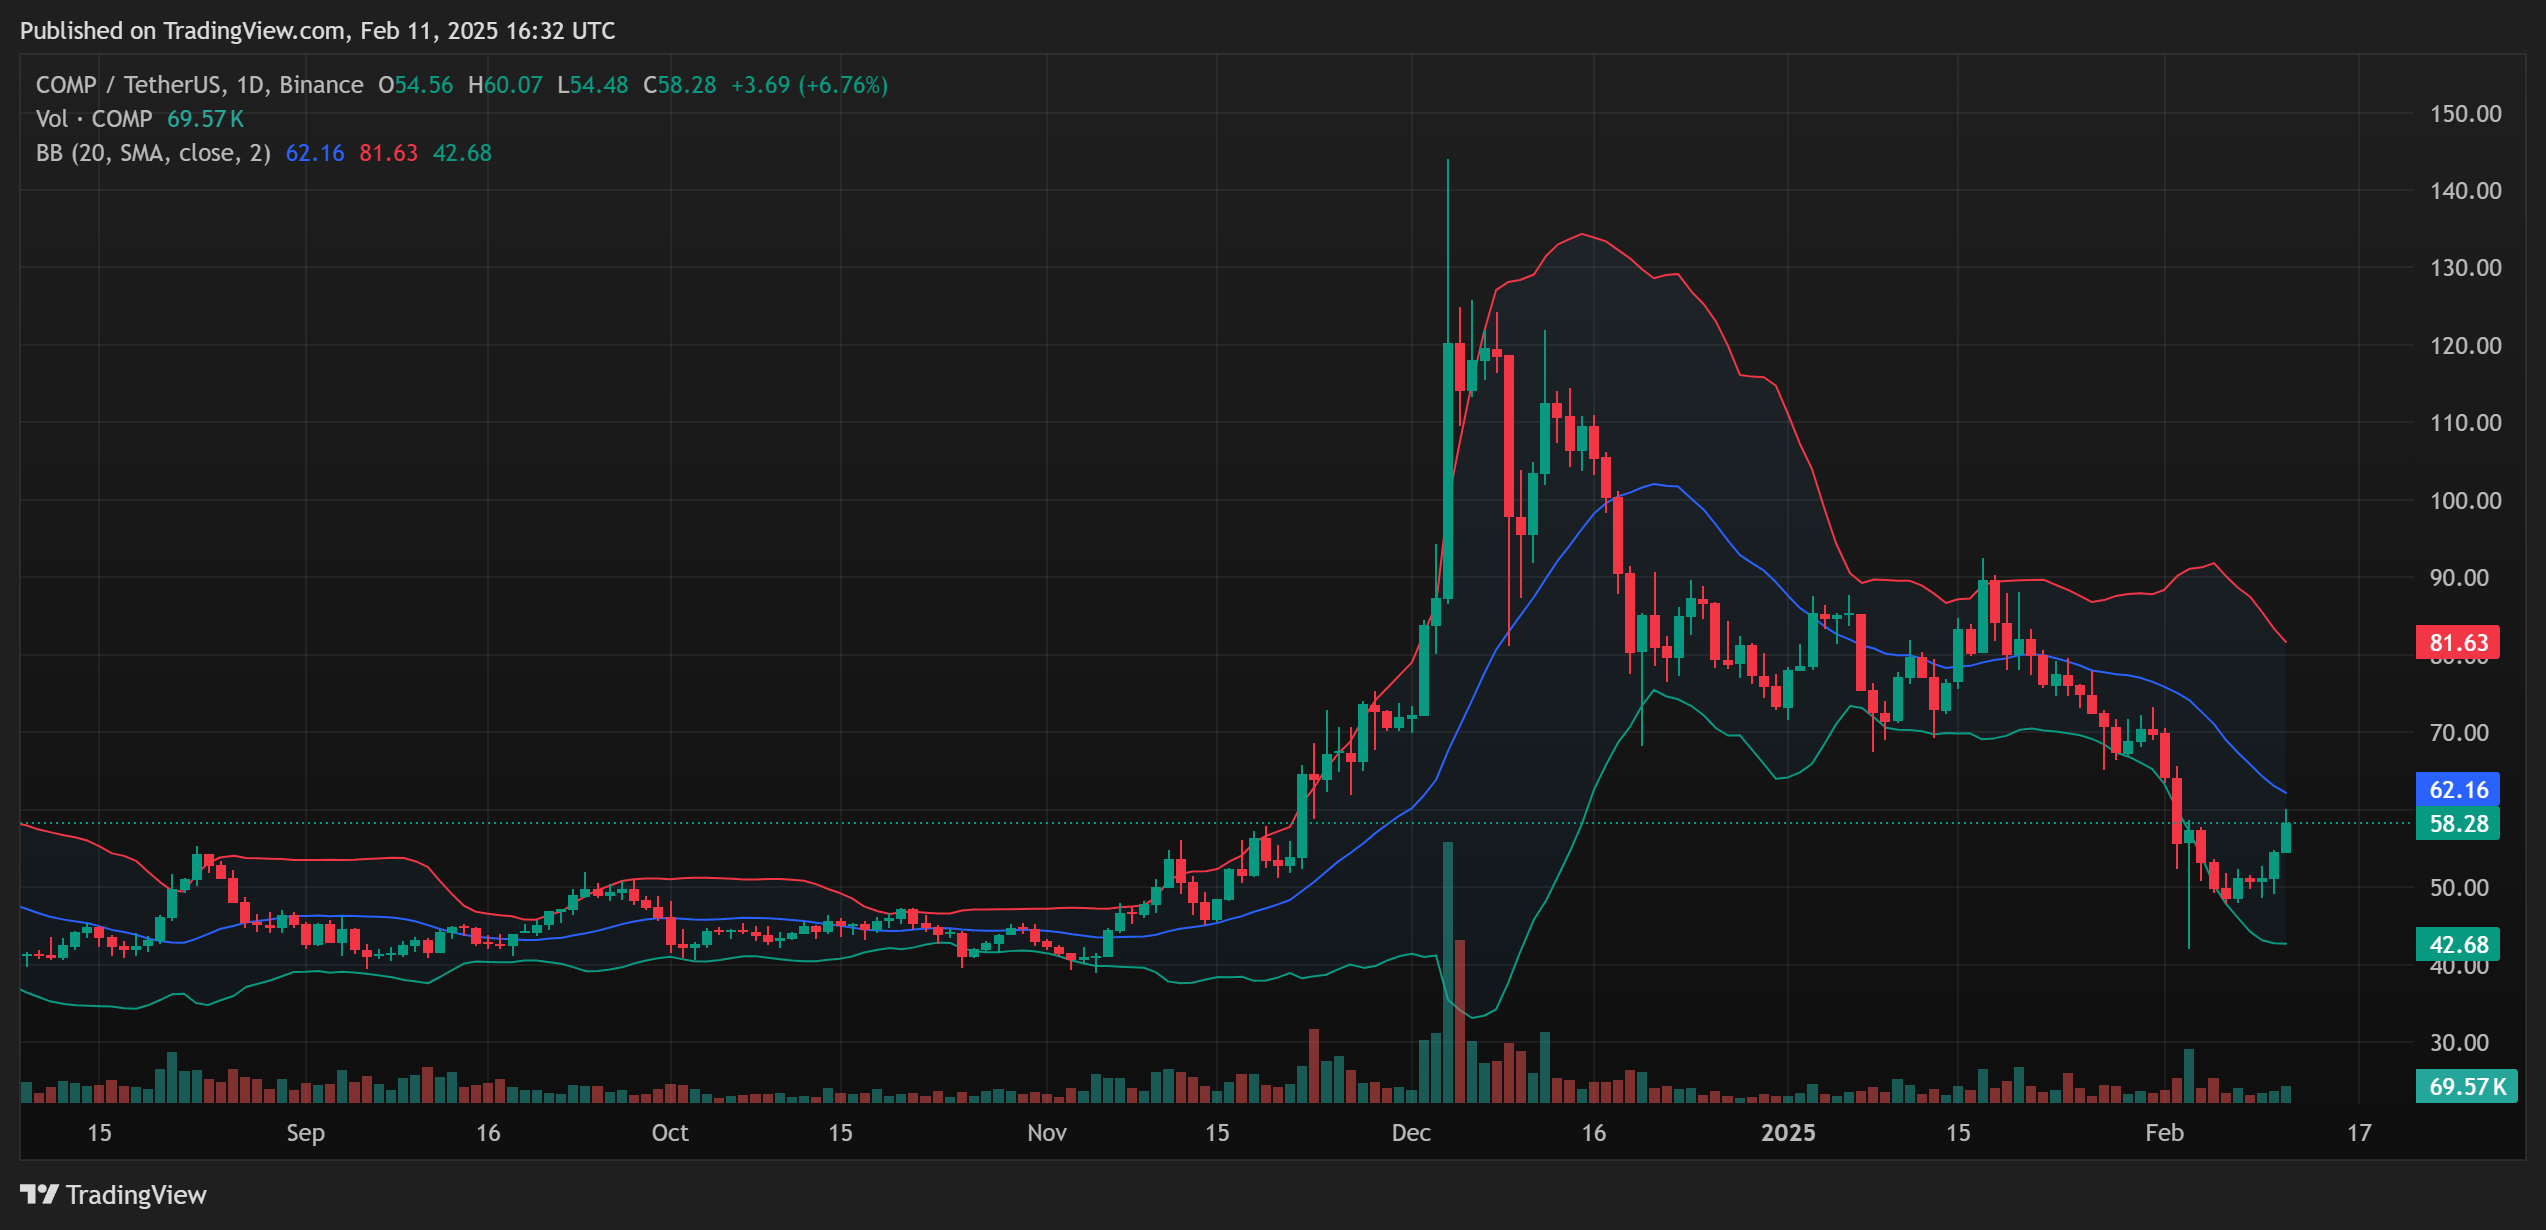
The Bollinger Bands show the Compound token emerging from a lower band compression phase. The price breaking toward the midline suggests that volatility is expanding upward, further supporting bullish expectations. If the token sustains its position above the $56 support level, the next major resistance lies at the $62.16 Bollinger midline.
Source: TradingView
A decisive break above this point could pave the way toward the $73 target identified by Martinez. However, a failure to hold the $56 support would likely expose COMP to further downside pressure, with the next key support zone around $42.68.
Disclaimer: Coinspeaker is committed to providing unbiased and transparent reporting. This article aims to deliver accurate and timely information but should not be taken as financial or investment advice. Since market conditions can change rapidly, we encourage you to verify information on your own and consult with a professional before making any decisions based on this content.
A crypto journalist with over 5 years of experience in the industry, Parth has worked with major media outlets in the crypto and finance world, gathering experience and expertise in the space after surviving bear and bull markets over the years. Parth is also an author of 4 self-published books.