Cardano Price Analysis: ADA/USD Trends of January 04–10, 2019

Updated on Apr 28, 2022 at 11:15 am UTC by · 2 mins read

For a bullish bias to form there is a need for Cardano price to go above the supply zone at $0.046. On the downside, the demand zone at $0.035 stands to be broken, and that will require a strong selling pressure.

Key Highlights:

  • Side-ways movement confirmed in the Cardano market;
  • traders should wait for a breakout;
  • ADA price may continue its uptrend on 4-Hour chart.

ADA/USD Price Long-term Trend: Ranging

Supply Zones: $0.046, $0.054, $0.066
Demand Zones: $0.035, $0.026, $0.019On the daily chart, ADA is on the ranging trend. At the moment, the coin could not trade higher nor lower indicating the strength of buyer and seller are at equilibrium. Cardano price is range-bound within $0.046 supply zone and $0.035 demand zone. The uptrend movement was interrupted with the Doji candle formation on December 24 followed by a big bearish candle indicating the bearish pressure which extended toward the $0.035 demand zone but unable to penetrate it. This scenario led to a sideways movement.

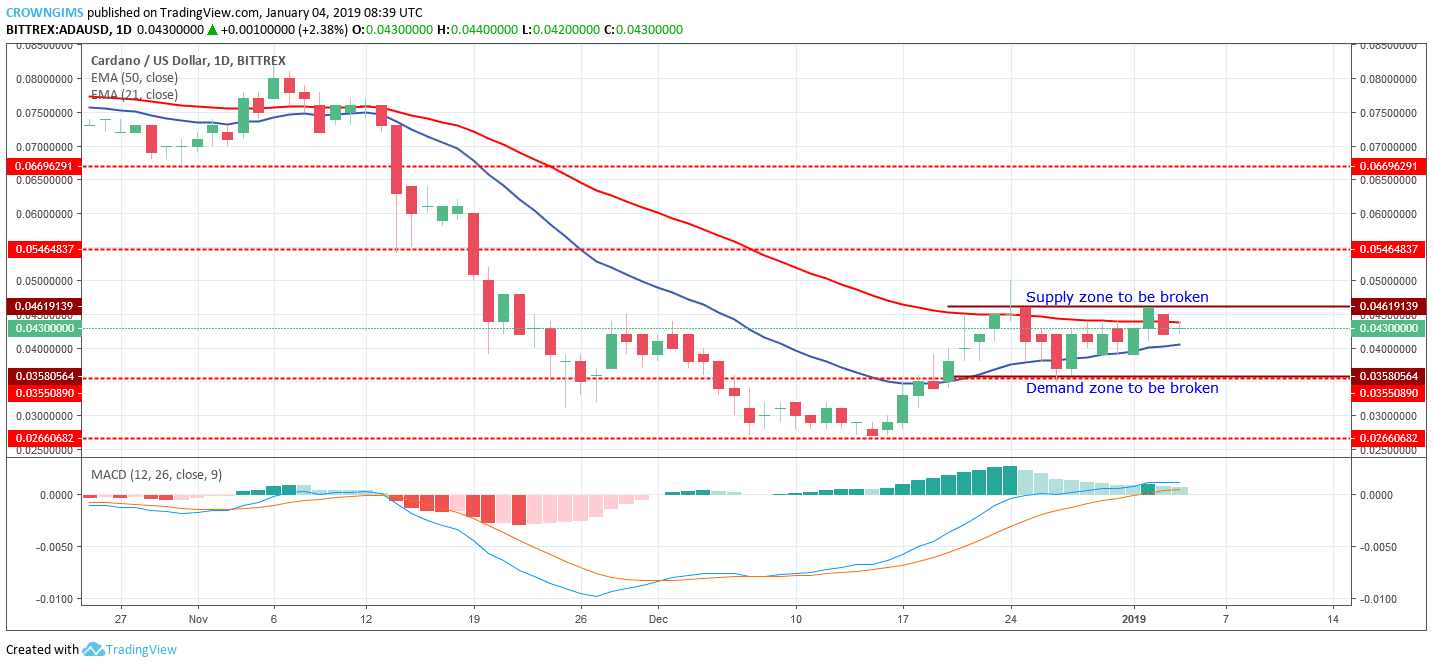
Now, the coin is flipping over and in-between the two EMAs within the range which indicate that side-ways movement is ongoing. The MACD with its histogram is faintly above the zero levels and the signal lines remain flat on the zero levels implies that the ranging movement may continue for a moment. Only a radical fundamental event can forcefully bring about a significant rally in the market.

For a bullish bias to form there is a need for Cardano price to go above the supply zone at $0.046. On the downside, the demand zone at $0.035 stands to be broken, and that will require a strong selling pressure. All this will result in a directional bias.


ADA/USD Price Medium-term Trend: Bullish

Cardano is bullish within the channel on the medium-term outlook. Recently, the cryptocurrency tried to break downwards but more buyers came in at the demand zone of $0.035, and price pushed further northwards by broken upside the two dynamic resistance level (21-day and 50-day EMA).

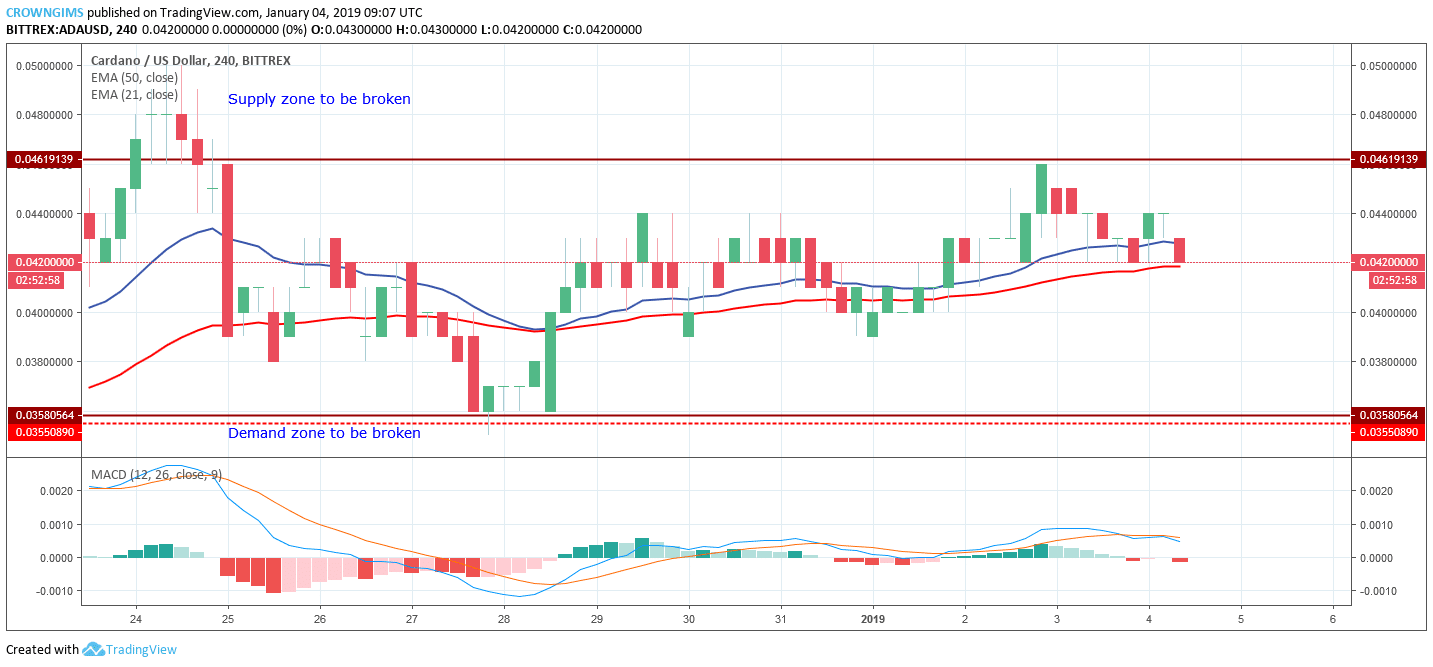
In the 4-hour chart, Cardano price is above the 21-day EMA and 50-day EMA, which connotes the possibility of an upwards trend continuation should the supply zone of $0.046 is broken. Traders should wait for the breakout before taking a long position.

On the 4-hour chart, the MACD indicator is parallel at the zero levels and the signal lines above zero level twisted to each other bending downwards connotes sell signal.

Share:

Related Articles

Solana, XRP, Cardano Rebound as Bitcoin Digital Gold Narrative Gains Momentum

By April 21st, 2025

Solana, XRP, and Cardano see notable increases as Bitcoin regains its digital gold narrative amid global inflation concerns and a weak US dollar.

Cardano Price Stabilizes But Market Bulls Push For More

By April 15th, 2025

Cardano gains 10% weekly, holding steady at nearly $0.637 as whales increase holdings. Traders watch for a breakout above the 20-day EMA.

Cardano Founder Predicts Bitcoin Could Reach $250,000

By April 10th, 2025

Cardano founder Charles Hoskinson believes Bitcoin’s price could rise over 100% to reach $250,000 this year.

Exit mobile version