Cardano (ADA) Price Analysis: Trends of October 5–11, 2018

On Oct 5, 2018 at 2:43 pm UTC by · 2 mins read

The price has formed a “symmetrical triangle” pattern on the 4-Hour chart. It is currently below the 4-day EMA which has crossed the 50-day EMA downward below the supply zone of $0.08 inside the symmetrical triangle. The bullish breakout from the symmetrical triangle is imminent.

Key Highlights:

  • The bullish breakout from the symmetrical triangle is imminent;
  • confirmation of the symmetrical triangle pattern on 4-Hour chart;
  • traders should patiently watch out for the breakout.

ADA/USD Price Long-term Trend: Ranging

Supply Zones: $0.08, $0.11, $0.13
Demand Zones: $0.05, $0.04, $0.03ADAUSD continued ranging in its long-term outlook. The bulls were not able to push the price up beyond last week level of $0.08 due to low momentum. The same way the Bears’ pressure was too weak to push the coin down below $0.08. On the September 19th, the Bulls were able to push the price from the demand zone of $0.05; broke the upper trend line moved toward the dynamic resistance of 50-day EMA and started consolidation at the supply zone of $0.08.

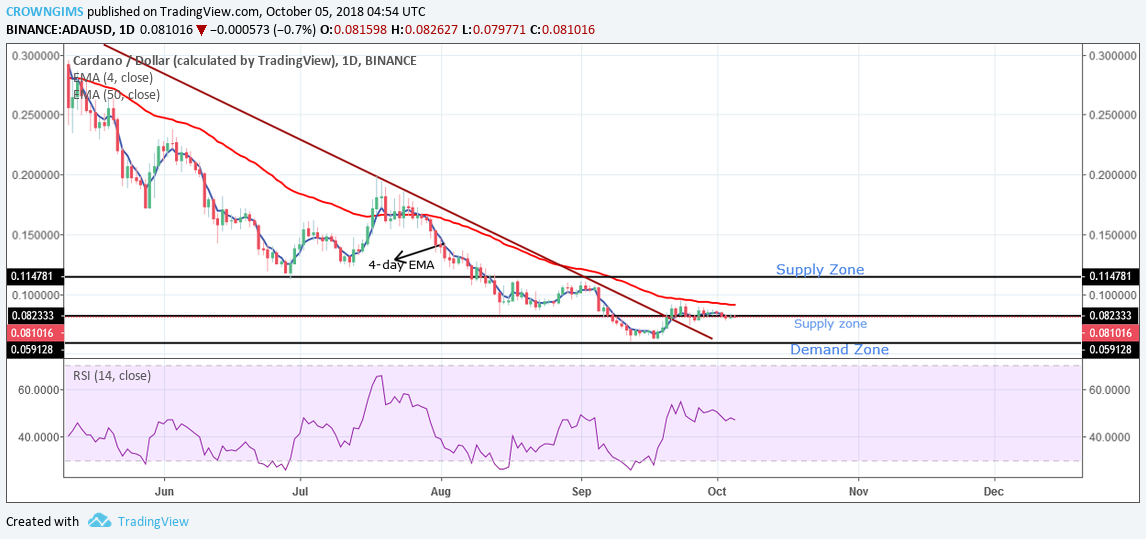
Currently, the price is between the 4-day EMA and the 50-day EMA at $0.08. In case the bulls increase their activities in the market the price will rally to the north. It is an only radical fundamental occurrence that can bring about a significant change in the market this week.

There is a probability that the price may break out of the supply zone of $0.08, move upward towards the upper supply zone of $0.11 should the buyers increase their momentum. Meanwhile, the RSI 14 is at 50-levels pointing downward indicating sell signal. Traders should trade cautiously within the range adopting best range strategy to take a small profit.

ADA/USD Medium-term Trend: Bearish

ADA/USD on the medium outlook is bearish. The price moved up last week and broke the supply zone of $0.08. The sellers increased their activities in the market with the bearish engulfing candle and the price decreased below the supply zone of $0.08. The price has formed a “symmetrical triangle” pattern on the 4-Hour chart. It is currently below the 4-day EMA which has crossed the 50-day EMA downward below the supply zone of $0.08 inside the symmetrical triangle. The bullish breakout from the symmetrical triangle is imminent.

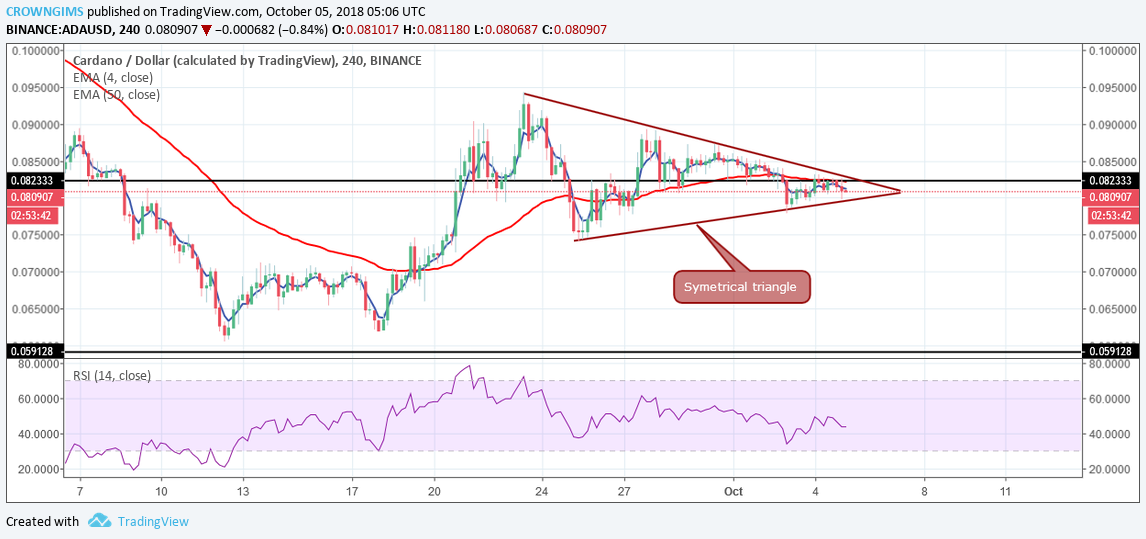
The RSI 14 is above 40 levels with the signal line pointing upwards. There is a probability for the coin to experience uptrend movement by break out to the north from the symmetrical triangle and rally to the supply zone of $0.11. Traders should patiently watch out for the breakout.

Share:

Related Articles

Cardano Price Stabilizes But Market Bulls Push For More

By April 15th, 2025

Cardano gains 10% weekly, holding steady at nearly $0.637 as whales increase holdings. Traders watch for a breakout above the 20-day EMA.

Cardano Founder Predicts Bitcoin Could Reach $250,000

By April 10th, 2025

Cardano founder Charles Hoskinson believes Bitcoin’s price could rise over 100% to reach $250,000 this year.

Cardano (ADA) to $1? Analyst Eyes This Support Level

By April 4th, 2025

Cardano (ADA) is hovering around the $0.65 support level, with the analyst warning of a possible 10% drop, but also eyeing a potential rebound to $1.

Exit mobile version