Bitcoin SV Price Analysis: BSV/USD Trends of December 26–January 01 2019

Updated on Apr 28, 2022 at 11:15 am UTC by · 2 mins read

The breakdown of the $92 price level will expose the coin to $85 support level. In case the support level of $92 holds Bitcoin SV price will resume its bullish trend.

Key Highlights:

  • Bitcoin SV price is moving sideways on the 1-Hour chart;
  • the Bulls lost the pressure on the BSV market;
  • break out is imminent.

BSV/USD Price Medium-term Trend: Bearish

Resistance levels: $92, $100, $106
Support levels: $85, $80, $73Bitcoin SV Price Analysis: BSV/USD Trends of December 26–January 01 2019On the medium-term outlook, BSV/USD is on the bearish trend. The coin was very bullish early last week before the bears opposed the rice of Bitcoin SV price. The bullish momentum places the BSV price at the high of $132 on December 21. An evening star candle pattern formed which signify the arrival of the bears with high pressure. BSV/USD was pushed down to the $107 price level, it consolidated for almost three days before it continued its bearish trend which landed the BSV price at $92 price level after $107 and $100 price level had broken downside.

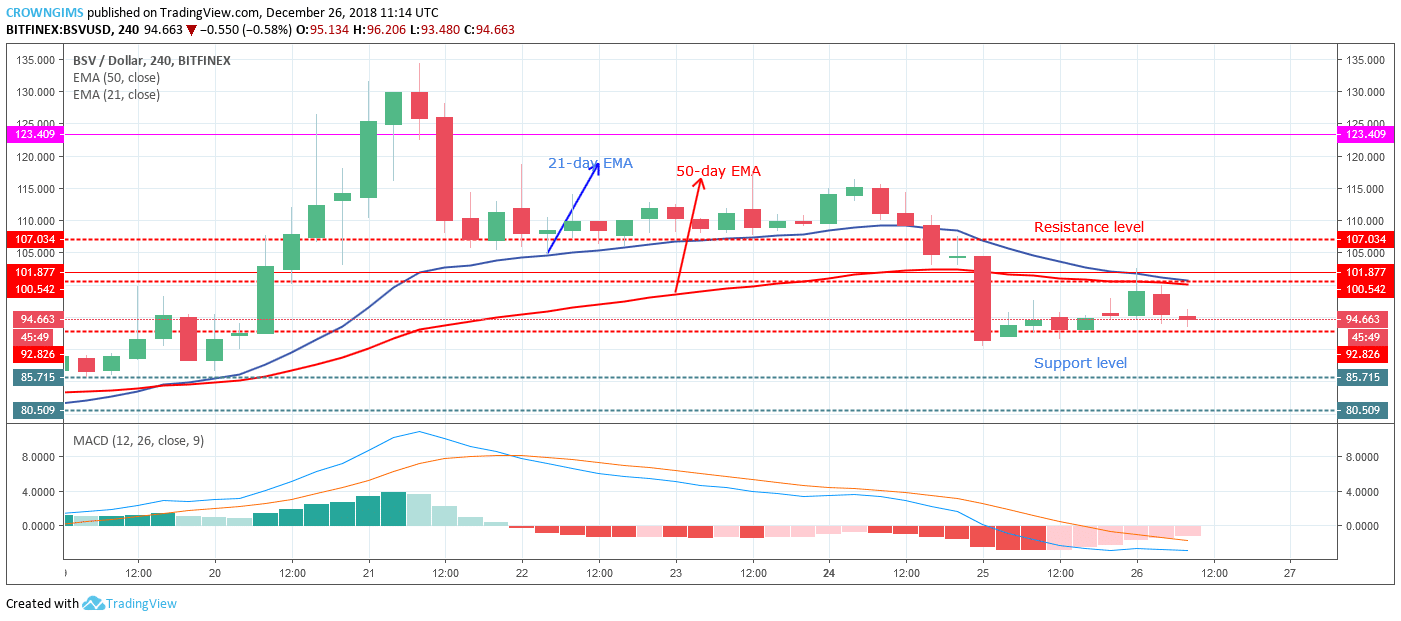
Bitcoin SV price is already below the two EMAs around $92 price level where21-day EMA is above 50-day EMA making an attempt to cross the 50-day EMA downside which indicates that the bearish momentum is increasing on the BSV market. The MACD period 12 and its histogram is below zero levels and the signal lines below which indicates that the coin may sell further.

BSV/USD Price Short-term Trend: Ranging

Bitcoin SV Price Analysis: BSV/USD Trends of December 26–January 01 2019BSV/USD is ranging on the short-term outlook. The first candle at the opening of the BSV market yesterday on the 1-Hour chart is a massive bearish candle that broke through the $100 former support level and rides down and found support at $92 price level. The coin started ranging movement between the $100 and $92 price level.

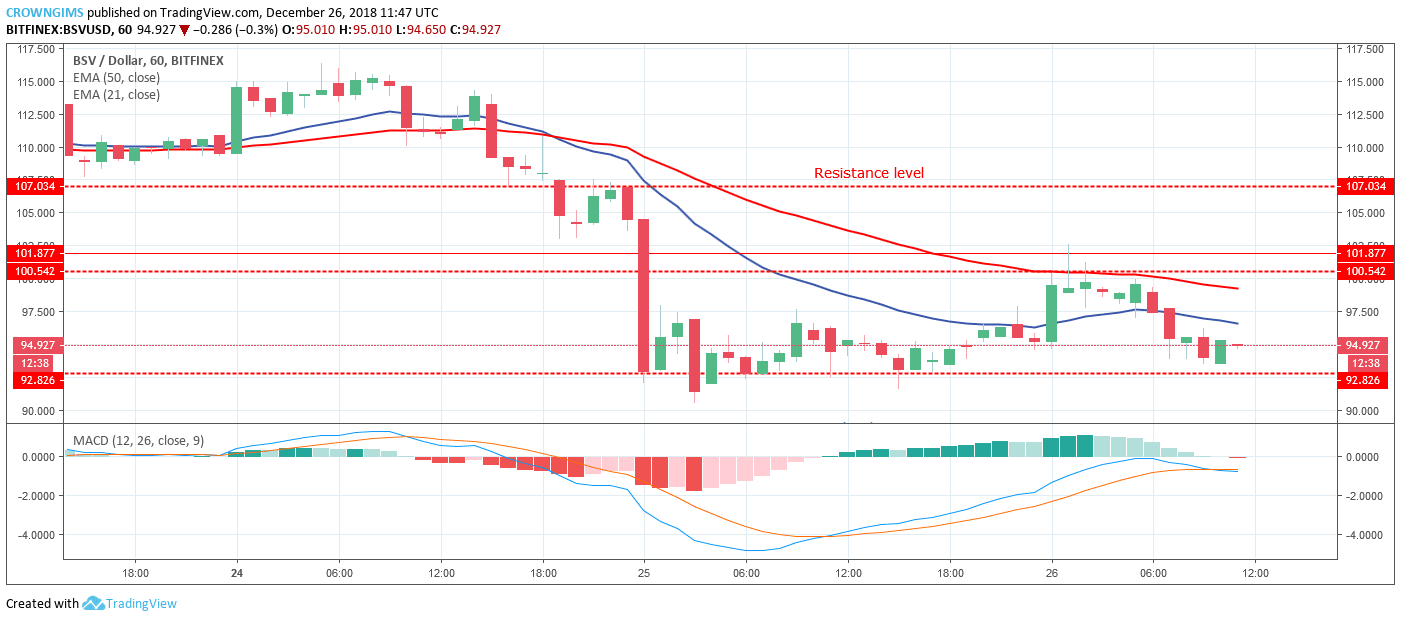
The 21-day EMA and 50-day EMA are placed horizontally on the chart with the Bitcoin SV price hovering around it; this confirms the ranging movement within the BSV market on the 1-Hour chart. The MACD’ s histogram is flat on the zero level with the signal lines interlocked and horizontally placed without direction which indicates that sideways movement is ongoing. Breakout is imminent.

The breakdown of the $92 price level will expose the coin to $85 support level. In case the support level of $92 holds BSV price will resume its bullish trend.

Share:

Related Articles

Crypto Price Analysis July 22: BTC, ETH, LTC, BSV, EOS

By July 22nd, 2020

The cryptocurrency market was overwhelmed by bulls over the last 24 hours.

Saga Not Over: Craig Wright May Face Class-Action Lawsuit for Forgery and Fraud

By August 30th, 2019

Bitcoin investor, trader and cryptocurrency celebrity hailing from England, Peter McCormack is about to file a lawsuit against Craig Wright, Calvin Ayre and Jimmy Nguyen on account of forgery and fraud.

Craig Wright Lost Case Against Ira Kleiman, Must Give 50% of Bitcoin Mined

By August 27th, 2019

The latest hearing in a multi-billion-dollar lawsuit resulted in Judge Bruce Reinhart recommending 50 percent of Wright’s BTC holdings mined prior to December 31, 2013, be awarded to the estate of Dave Kleiman.

Exit mobile version