
“Double bottom” pattern was formed as it is clearly seen on the chart which indicates that BSV price may hit $92 price level in which if the level is broken the coin may have its high at $96 price level.
Key Highlights:
- Bitcoin SV price may hit $92 price level;
- the Bulls are taking over BSV market gradually;
- the Bears may lose the momentum.
BSV/USD Price Medium-term Trend: Bearish
Resistance levels: $92, $96, $101
Support levels: $89, $85, $80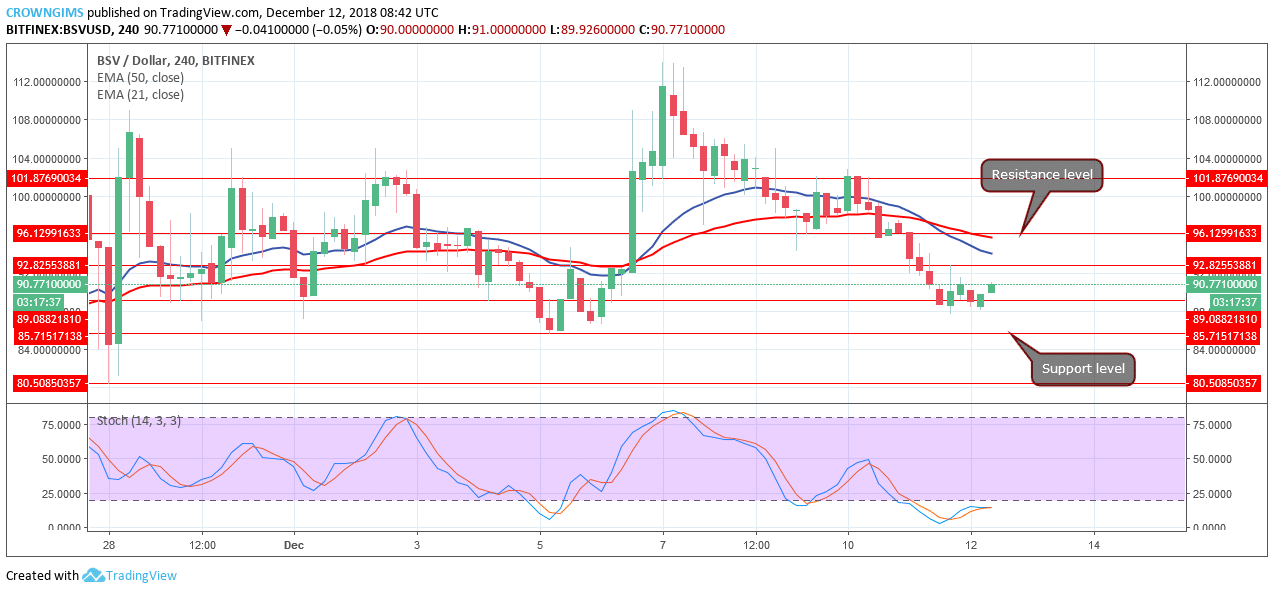

BSV price is currently consolidating on the support level of $89, below the 21-day EMA and 50-day EMA with a distance away from each other indicating the bearish trend is ongoing. The Stochastic Oscillator period 14 is at the oversold region (below 25 levels) with signal lines interlocked as a sign of consolidation. It equally indicates that Bitcoin SV has strong bearish momentum and sell signal.
In case the bears break the demand level of $89 downside, the crypto will find support at the previous low of $85 – $80. An uptrend will be anticipated in case the $89 price level holds.
BSV/USD Price Short-term Trend: Bearish

“Double bottom” pattern was formed as it is clearly seen on the chart which indicates that BSV price may hit $92 price level in which if the level is broken the coin may have its high at $96 price level. In case the bears defend $96 price level, the coin will bounce and resume its bearish trend.
Meanwhile, the Stochastic Oscillator period 14 is above 40 levels with signal lines points upward which indicates buy signal.
next