Bitcoin Price Analysis: BTC/USD Trends of November 26–December 02, 2018

Updated on Apr 28, 2022 at 11:13 am UTC by · 2 mins read

The Bitcoin price of $3,450 is a crucial accumulation territory which may return the bulls into the market. However, if broken downside it will lead to a new low of $2,937.

Key Highlights:

  • Bears hold tight to the Bitcoin market;
  • the BTC price may decrease further;
  • there is a probability of the pullback.

BTC/USD Long-term Trend: Bearish

Distribution Territories: $4,217, $5,457, $6,035
Accumulation Territories: $3,450, $2,937, $1,803Bitcoin continues its bearish movement on the long-term outlook. Barely over two weeks ago BTC price was ranging before $6,035 was breached southward and the coin started dropping to a low of $4,217 accumulation territory last week. The bears broke downside the accumulation territory of $4,217 and the BTC price are currently facing the accumulation territory of $3,450.

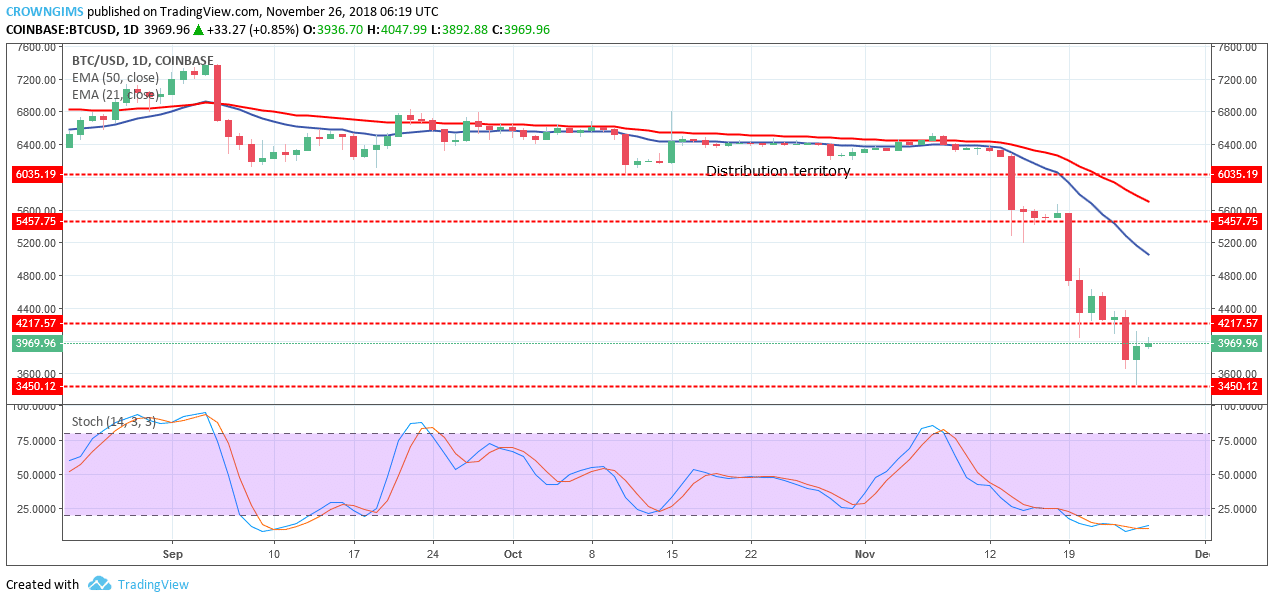
Currently, the coin is pulling back to retest the broken territory. A bearish movement may continue as 50-day EMA is over 21-day EMA which are well separated while the Bitcoin price is below the two EMAs. The Stochastic Oscillator period 14 have dipped into the oversold region with the signal lines seems to be pointing to the north which indicates that the bullish movement may be experienced as a pullback.

The BTC price of $3,450 is a crucial accumulation territory which may return the bulls into the market. However, if broken downside it will lead to a new low of $2,937.

BTCUSD Medium-term Trend: Bearish

BTC/USD is bearish on 4-Hour chart. BTC price broke out of consolidation territory of $5,457 and rallied down the accumulation territory of $4,217 at which it commenced another consolidation. On November 24 it broke downside the accumulation territory of $4,127 and had its low at $3,450 price level where it is currently experiencing pull back.
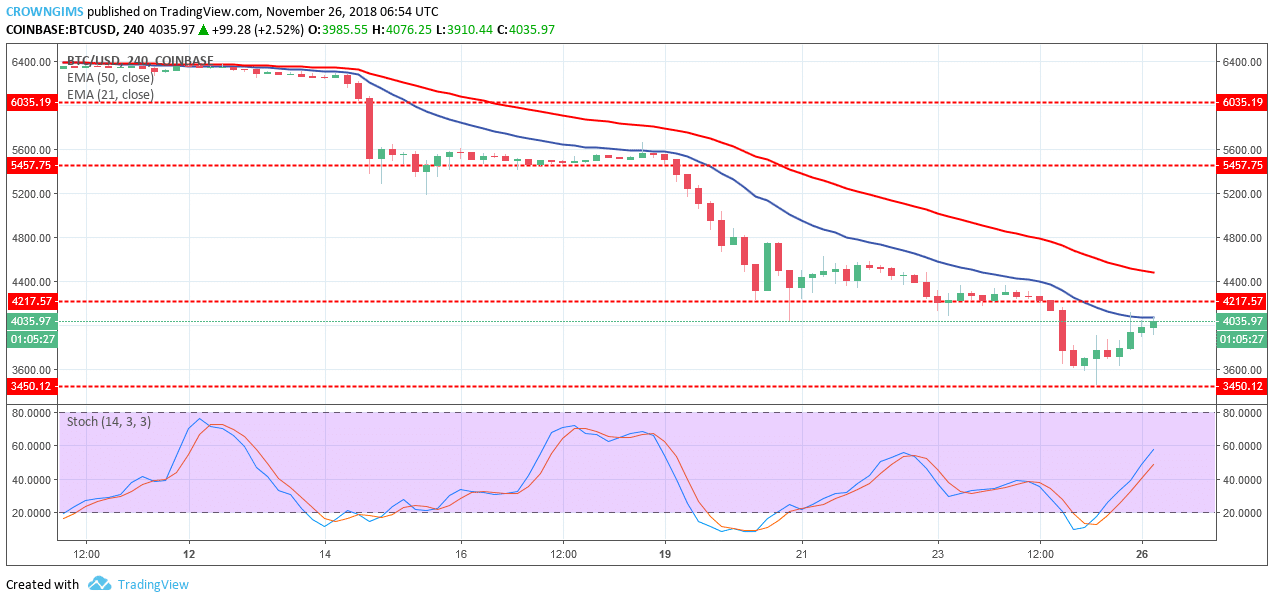
The BTC price is below the 21-day EMA and 50-day EMA.

The Stochastic Oscillator period 14 is above 50 levels with the signal lines point to the north implies buy signal in which if the bullish pressure continues and a breakout upside above the distribution territory of $4,217 is experienced, this could see Bitcoin get past various distribution territories, up to the $5,457 territory, otherwise, the bearish movement continues.

Share:

Related Articles

Bitcoin News Today: BTC Price Skyrockets 8% from $80K Low, Bulls Target Six-Figure Breakthrough

By March 3rd, 2025

Bitcoin surged 8% on Monday, fueled by Trump’s crypto reserve announcement, with analysts viewing it as a good buying opportunity.

BitMEX CEO Arthur Hayes Tips BTC Price Drop Under $50K by Weekend

By September 6th, 2024

Veteran trader Peter Brandt shared the BTC price chart also echoed Arthur Hayes’ bearish sentiment predicting a BTC price drop to $46,000 levels.

Bitcoin Price on Brink of Further Decline as US Spot BTC ETFs Continues to Bleed

By September 6th, 2024

Fear of further Bitcoin price capitulation in the short term significantly increased amid continued sell-offs from whale investors.

Exit mobile version