Bitcoin Price Analysis: BTC/USD Trends of January 14–20, 2019

Updated on Apr 28, 2022 at 11:15 am UTC by · 2 mins read

If the bears maintain their bearish momentum the previous low of $3,247 price level may be the target of Bitcoin.

Key Highlights:

  • Bitcoin price broke out of the ranging movement;
  • the Bulls lost the momentum on the 4-Hour chart;
  • there is a probability for further declination of BTC price.

BTC/USD Long-term Trend: Bearish

Resistance levels: $3,679, $4,249, $4,715
Support levels: $3,247, $2,765, $1,956BTC/USD broke out the ranging phase on the long-term outlook. The cryptocurrency eventually broke out of the range-bound movement between the resistance level of $4,249 and the last week support level of $3,677 which the Bitcoin price has been involved for over two weeks. The bearish broke out took place on December 13 after the formation of the big bearish candle. The $3,679 price level broken downside, exposing the coin to the support level of $3,247.

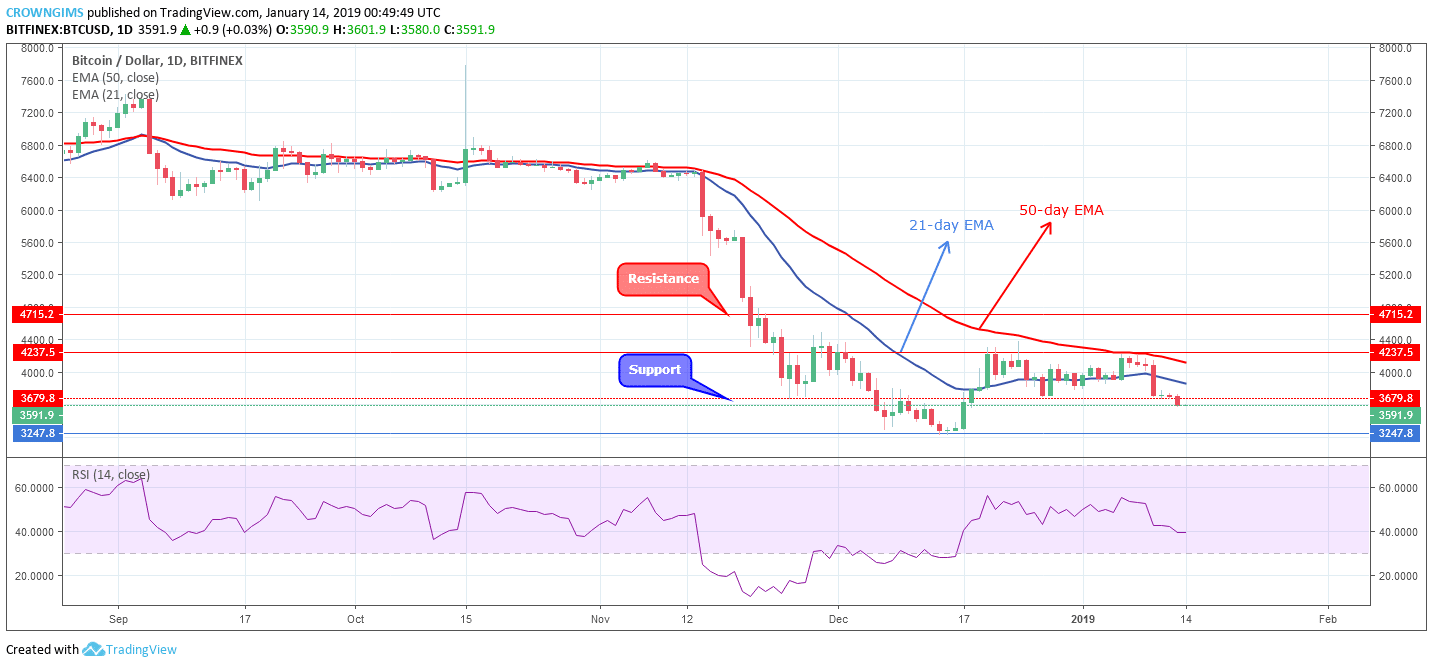
BTC price has broken the barrier of the two EMAs, currently trading below the 21-day EMA and 50-day EMA as evidence of bearish pressure. The Relative Strength Index period 14 is at 40 levels with the signal lines bending downward which signify that Bitcoin price will fall further. If the bears maintain their bearish momentum the previous low of $3,247 price level may be the target of the coin.

BTCUSD Medium-term Trend: Bearish

BTC/USD resumes bearish trend on the medium-term outlook. Bitcoin price found its high at $4,237 price level last week and a further increase was rejected by the bears. Further increase of the bears’ momentum pushed the coin to cross the two EMAs downside by the formation of bearish engulfing candle followed by the massive bearish candle. The former support level of $3,679 was broken down and the BTC price facing the support level of $3,247.

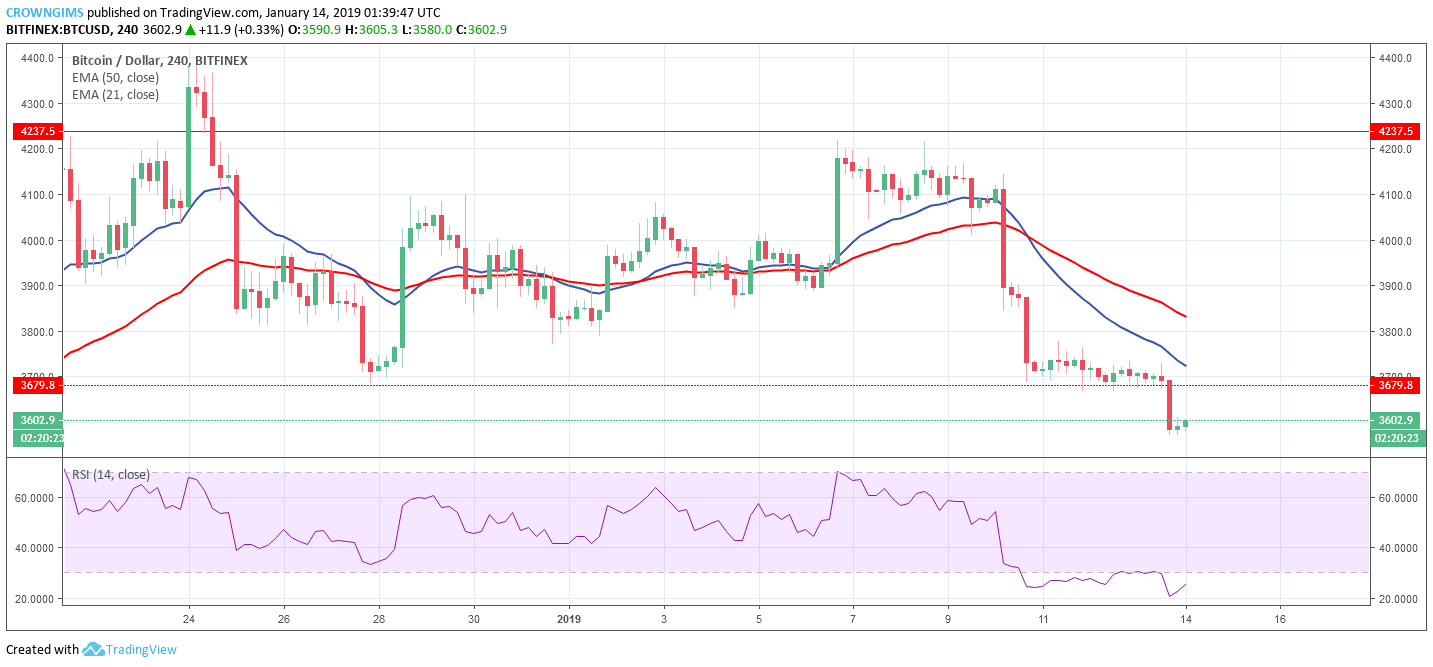
The 50-day EMA is currently placed above the 21-day EMA with Bitcoin price trading below the two EMAs which indicates the high momentum of the sellers. The RSI period 14 is at 20 levels with the signal line pointing up which indicates buy signal; this could be a price retracement. A bullish rally may be envisaged in case the resistance level of $3,679 price level does not hold and a strong bullish candle is closed above the $3,679 price level.

Share:

Related Articles

Is Trump Coin the Next Bitcoin? TRUMP Soars as Holder Dinner Announced

By April 24th, 2025

President Donald Trump’s meme coin, TRUMP, is on a tear – soaring another 33% today, following yesterday’s massive 60% surge.

New Hampshire Bitcoin Reserve Bill Moves Forward to Full Senate Vote

By April 24th, 2025

The New Hampshire Bitcoin reserve bill is expected to be tabled before the full senate for a vote.

Metaplanet Breaks 5,000 Bitcoin Milestone as BTC Price Faces Consolidation

By April 24th, 2025

Japanese Bitcoin treasury company Metaplanet has crossed the 5,000 Bitcoin threshold as part of its long-term plan despite ongoing market uncertainty.

Exit mobile version