Bitcoin Price Analysis: BTC/USD Trends of December 31–January 06, 2019
The bearish candle will have to penetrate and close below the support level of $3,679 before BTC price will experience bearish breakout and this may return it to its previous low of $3,247.
By Azeez MustaphaUpdated
2 mins readPhoto: QuoteInspector
bearish breakout may return the Bitcoin price to its previous low.
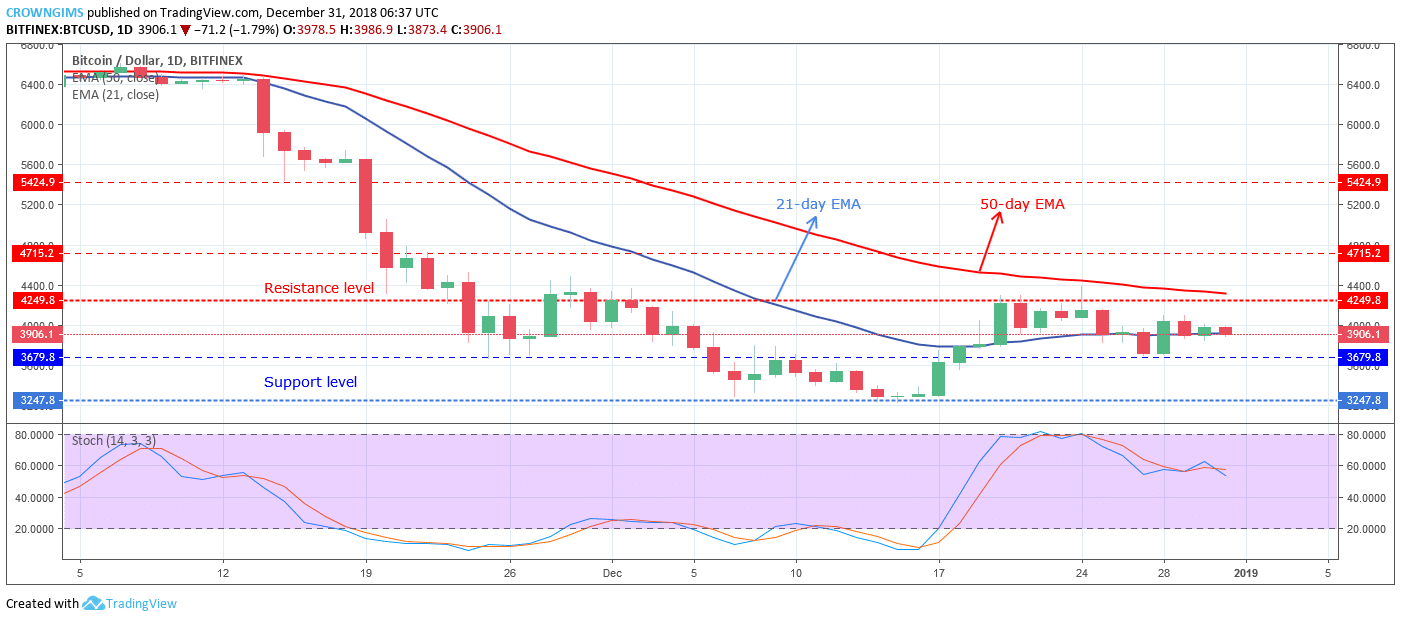
BTC/USD Long-term Trend: Ranging
Resistance levels: $4,249, $4,715, $5,424
Support levels: $3,679, $3,247, $2,765BTC/USD is ranging on the long-term outlook. The Bulls lost their pressure that took the BTC price up to $4,249 on December 24. The bullish pressure could not break up the dynamic resistance level of 50-day EMA. The shooting star candle pattern formed confirms the bearish reversal movement during an uptrend which dropped the BTC price at the support level of $3,679. It is this kind of zigzag movement within the range of $4,249 resistance level and $3,679 support level Bitcoin price experienced last week.
BTC price is flipping around the 21-day EMA within the range. In other words, the coin is currently trading in-between 21-day EMA and 50-day EMA. It is certain that there would be either bullish or bearish breakout. The bearish candle will have to penetrate and close below the support level of $3,679 before BTC price will experience bearish breakout and this may return it to its previous low of $3,247. Meanwhile, the Stochastic Oscillator period 14 is at 60 levels with signal lines pointing down is an indication of a sell signal.
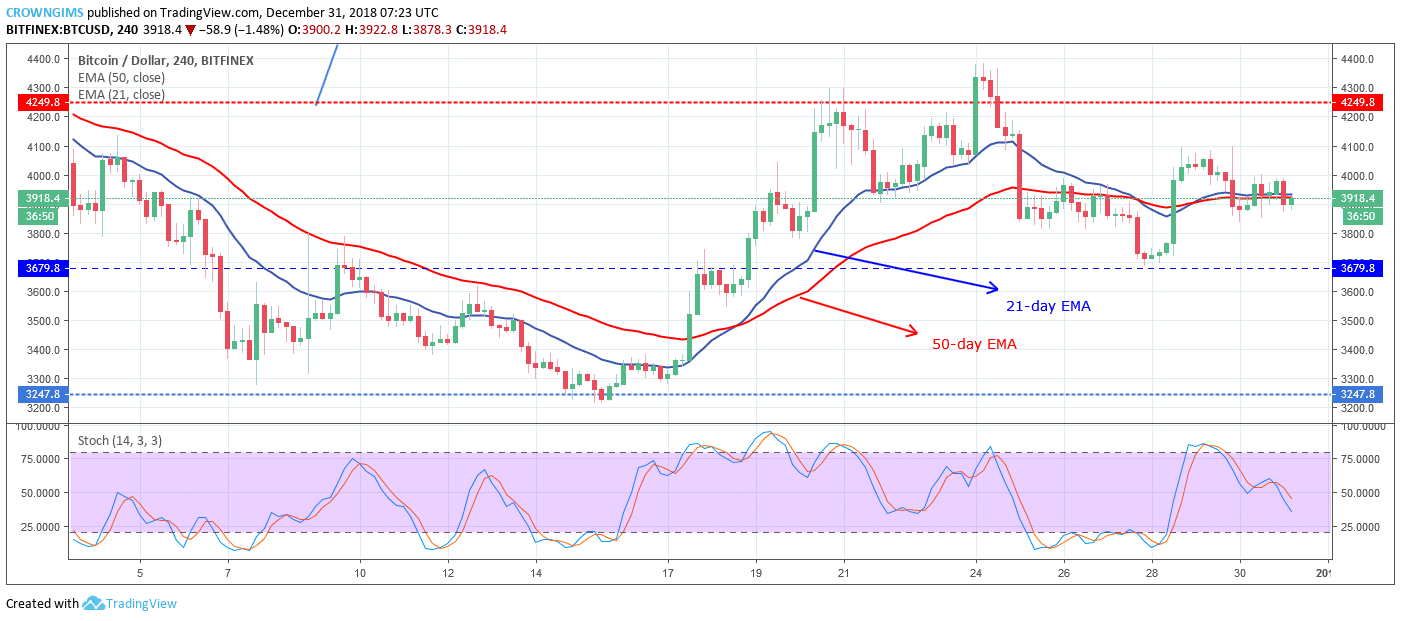
BTCUSD Medium-term Trend: Ranging
BTC/USD is ranging on the medium-term outlook. Bitcoin price topped above the resistance level of $4,249 on December 24 with the bullish momentum that started on December 17; the bears returned to the market with full force, this was noticed as the evening star candle pattern formed at the same price level on 4-Hour chart. The bearish pressure broke downside the $4,249 price level, extended down by penetrated the two dynamic support levels and bottomed at $3,679 on December 29 after which it started sideways movement
The Bitcoin price is trading around 21-day EMA and 50-day EMA with the two EMAs interlocked which connotes that consolidation is ongoing. However, the Stochastic Oscillator period 14 is below 50-levels with the signal lines pointing down indicate sell signal. In case a bullish candle penetrates and close above the resistance level of $4,249, then, a bullish trend may commence and have its target at $4,715.
Azeez Mustapha is a specialist in Computer Studies (including DTP), Forex and Crypto trading professional. Being expert technical and currency analyst, as well as experienced fund manager and author of several books, Azeez places strong focus on crypto market studies conducting comprehensive price analyses and sharing forecasts of presumptive market trends.

 BTC/USD is ranging on the long-term outlook. The Bulls lost their pressure that took the BTC price up to $4,249 on December 24. The bullish pressure could not break up the dynamic resistance level of 50-day EMA. The shooting star candle pattern formed confirms the bearish reversal movement during an uptrend which dropped the BTC price at the support level of $3,679. It is this kind of zigzag movement within the range of $4,249 resistance level and $3,679 support level Bitcoin price experienced last week.