Bitcoin Price Analysis: BTC/USD Trends of December 10–16, 2018
A breakout below the support level of $3,094 will further decline in Bitcoin price towards $2,261 – $1,500 price level. Traders can remain flat as long the consolidation continues.
By Azeez MustaphaUpdated
2 mins readPhoto: QuoteInspector
Key Highlights:
Traders should remain flat;
bulls may take over the Bitcoin market in case there is a breakout above $3,726;
break out is imminent.
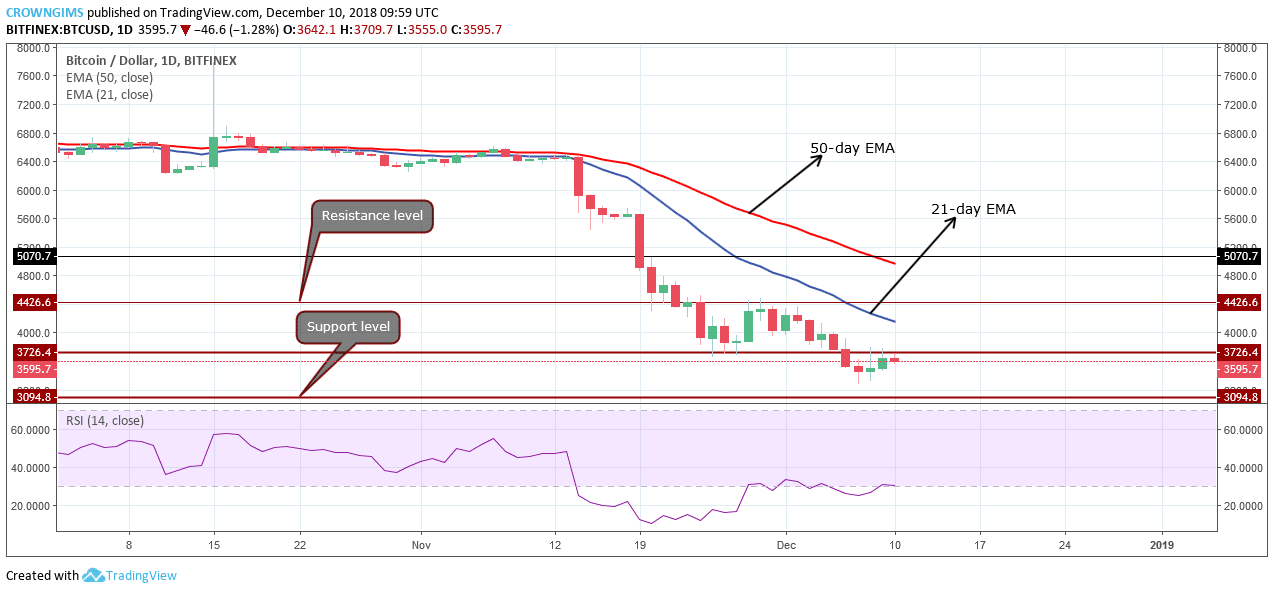
BTC/USD Long-term Trend: Ranging
Resistance levels: $3,726, $4,426, $5,070
Support levels: $3,094, $2,261, $1,500BTC/USD is ranging on the long-term outlook; the cryptocurrency started sideways movement on November 24 within the range of $4,426 and $3,726 price level and it continues till December 5. The bears gained pressure and pushed the coin down to break the former support level of $3,726, then started consolidating again. The Bitcoin price is currently exposed to support level of $3,094.
Although BTC price remains below the 21-day EMA and 50-day EMA as a sign of a bearish trend, the Relative strength index period 14 is on the 30 levels parallel/flat to the level without direction which indicates that consolidation is ongoing.
Should there be a clear penetration above the resistance level of $3,726 then the bullish rally will be anticipated towards the supply level of $4,426 – $5,070. A breakout below the support level of $3,094 will further decline in Bitcoin price towards $2,261 – $1,500 price level. Traders can remain flat as long the consolidation continues.
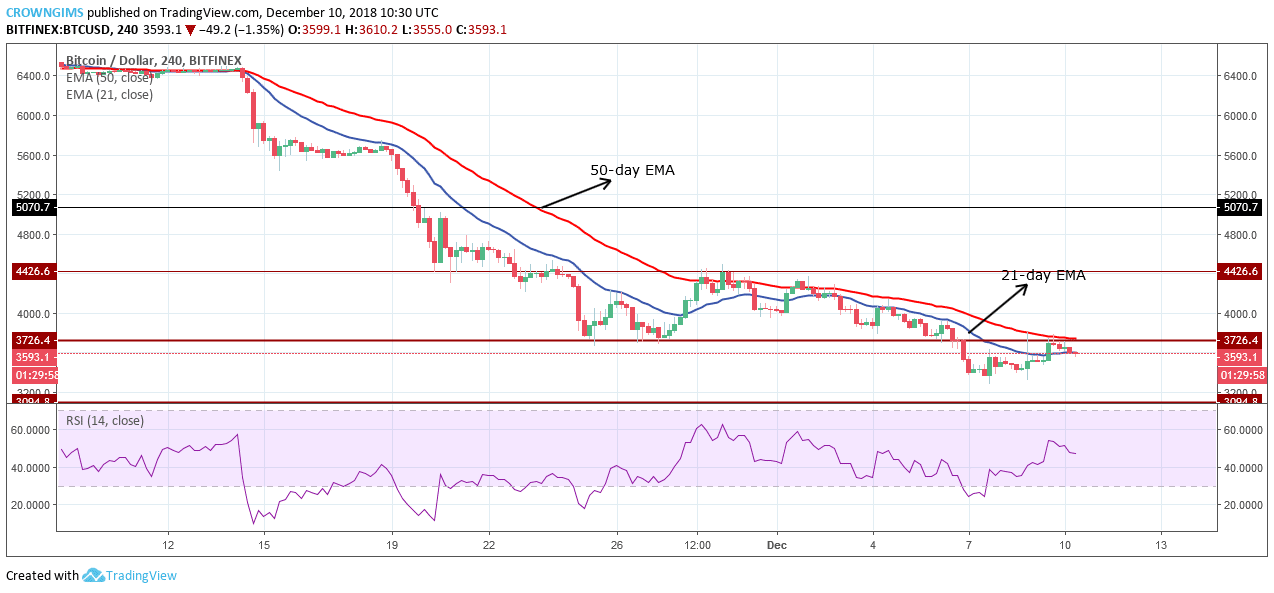
BTC/USD Medium-term Trend: Ranging
BTC/USD is ranging on 4-Hour chart. The coin has been range bound between the resistance level of $3,726 and the support level of $3,094 since December 6, shortly after the support level of $3,726 is broken downside.
The Bitcoin price is currently in between the 21-day EMA and 50-day EMA and the two EMAs were flat which indicates that consolidation is ongoing on the 4-Hour chart on the BTC market. However, the Relative Strength Index is above 40 levels bending to the south which connotes sell signal.
Azeez Mustapha is a specialist in Computer Studies (including DTP), Forex and Crypto trading professional. Being expert technical and currency analyst, as well as experienced fund manager and author of several books, Azeez places strong focus on crypto market studies conducting comprehensive price analyses and sharing forecasts of presumptive market trends.

 BTC/USD is ranging on the long-term outlook; the cryptocurrency started sideways movement on November 24 within the range of $4,426 and $3,726 price level and it continues till December 5. The bears gained pressure and pushed the coin down to break the former support level of $3,726, then started consolidating again. The Bitcoin price is currently exposed to support level of $3,094.