
Increase in the Bulls momentum will make the Bitcoin price to touch $5,716 level and may break up the level and face $5,910. In case $5,716 level holds BTC price may continue ranging within the level.
Key Highlights:
- Bitcoin price is currently consolidating on the 1-hour charts;
- the breakup at $5,574 level has exposed $5,716 resistance level;
- the Bulls are still in control of the Bitcoin market
BTC/USD Medium-term Trend: Bullish
Resistance levels: $5,716, $5,910, $6,120
Support levels: $5,574, $5,459, $5,255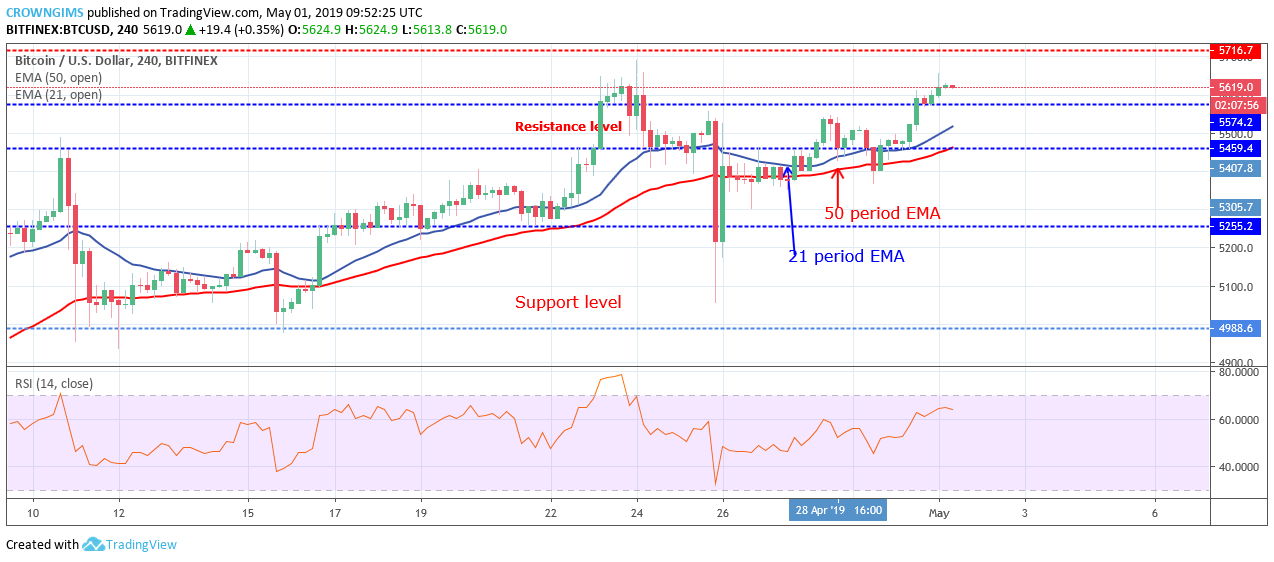

The distance between the Bitcoin price and the two EMAs is increasing; this indicates that the bullish momentum is increasing. Bitcoin is trading above the 21 periods EMA and 50 periods EMA. The Relative Strength index period14 is above 60 levels with the signal line bending down which connotes sell signal which may be a pullback.
Increase in the Bulls momentum will make the Bitcoin to touch $5,716 level and may break up the level and face $5,910 price level. In case $5,716 level holds Bitcoin price may continue ranging within the level.
BTC/USD Short-term Trend: Bullish
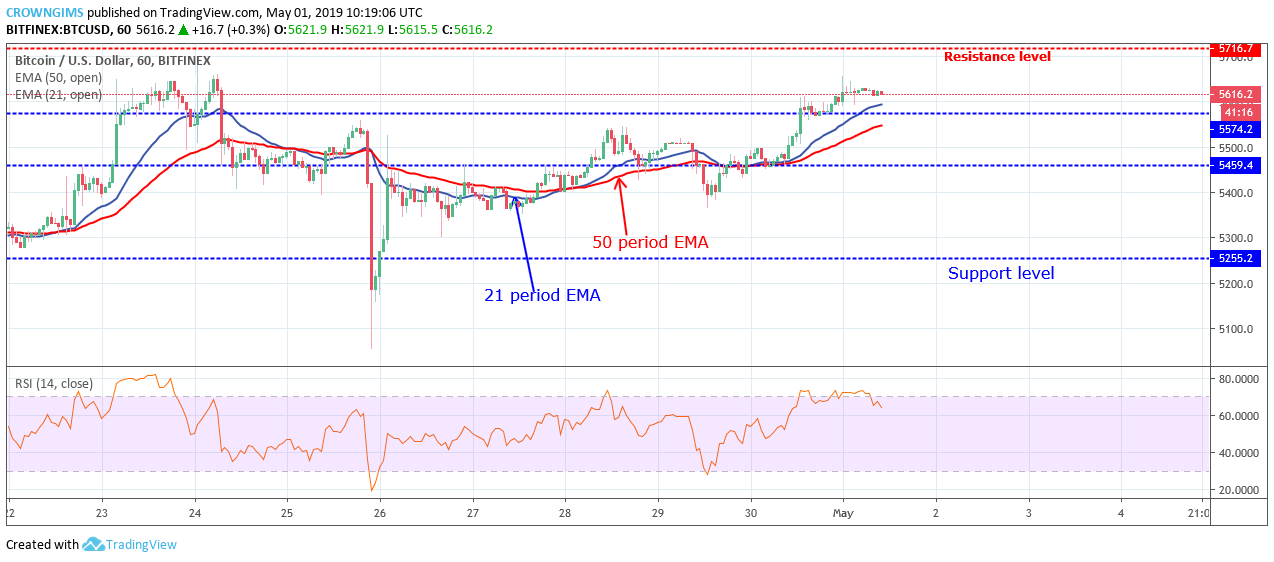
BTC/USD is on the bullish trend on the short-term outlook. Bitcoin price bounced at the demand level of $5,459 and the Bullish engulfing candle formed at the same level on April 30. This bullish pressure propelled the BTC price to the north and broke up the $5,574 level. The coin is currently facing the $5,716 price level.
BTC price continues its trading above the 21 periods EMA and 50 periods EMA with slow speed. However, the Relative Strength Index period 14 is above 60 levels with the signal lines pointing down to indicate sell signal.
next