
The bearish movement may continue and reach the demand level of $5,946. The bullish movement can continue only when the Bulls break up the $6,121 Bitcoin price level.
Key Highlights:
- The Bulls are may take over the Bitcoin market;
- the breakup at $6,121 level will expose $6,332resistance level;
- the Bitcoin price may bounce at $6,121 level.
BTC/USD Medium-term Trend: Bullish
Resistance levels: $6,121, $6,232, $6,341
Support levels: $5,946, $5,840, $5,716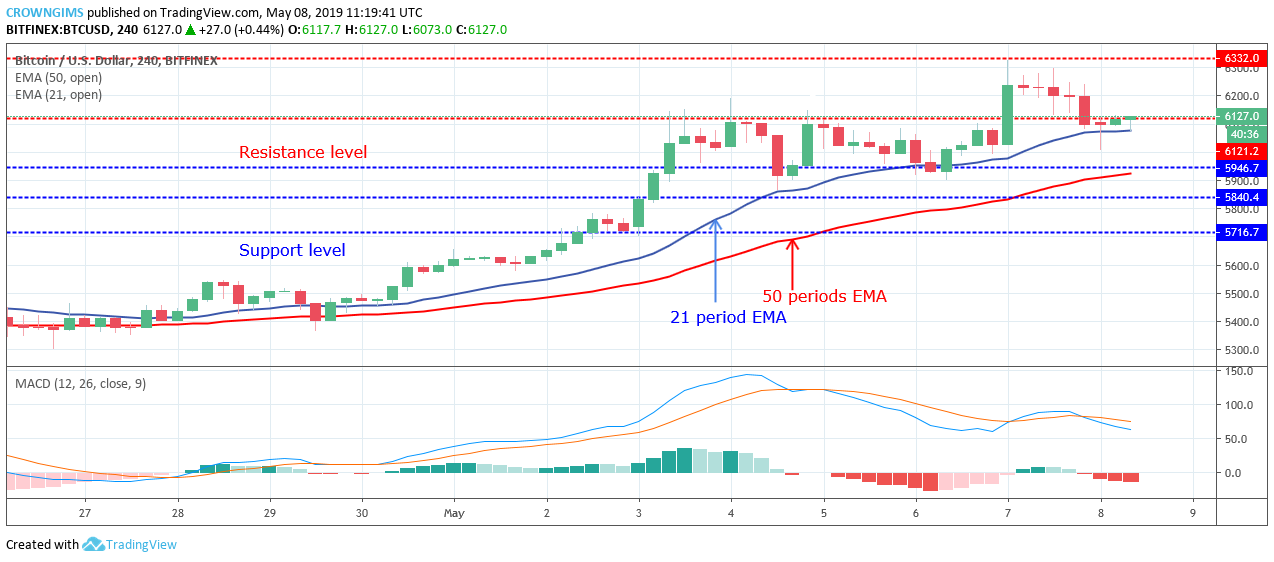

BTC price pulled back as a result of loss in momentum. The bears took over by the formation of Doji candles. $6,121 level was broken downside by the Bears’ pressure and the coin found support at dynamic support of 21-period EMA.
The Bitcoin price and the EMAs are still in touch consolidating on the 21 EMA. Bitcoin is trading on the 21 periods EMA and 50 periods EMA directly; this indicates that the Bulls are gradually losing their strength.
The bearish movement may continue and reach the demand level of $5,946 in case the Bears further exert more pressure. The bullish movement can continue only when the Bulls break up the $6,121 level. The Moving Average Convergence Divergence period 12 with its histogram is below zero levels and the signal lines bending down to connote sell signal.
BTC/USD Short-term Trend: Ranging
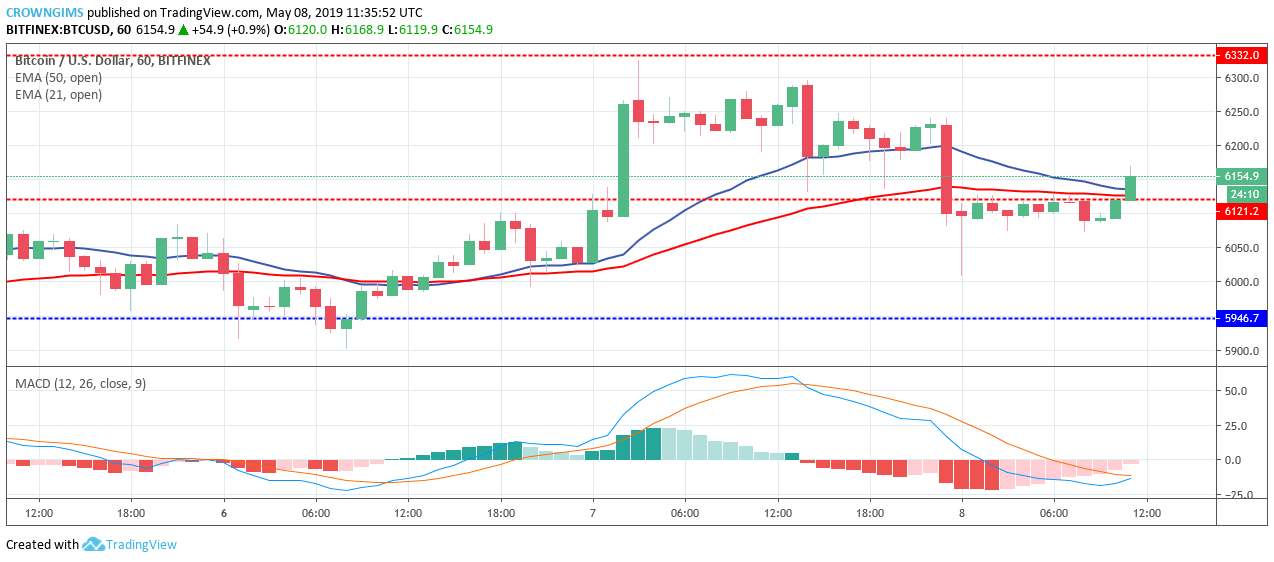
BTC/USD is ranging in the short-term outlook. A strong bearish candle emerged yesterday that broke down the two dynamic supports and resistances together with $6,121 level and the price dropped towards $5,946 but the Bears would not allow a further decrease in Bitcoin price.
The long bearish candle was pushed up to form a pin bar. Immediately after that, the coin started consolidating at $6,121 level.
However, the MACD period 12 is gradually turning up and the signal lines turning to the north to indicate the presence of the Bulls with high pressure.
next