Bitcoin Price Analysis: BTC/USD Trends of January 21–27, 2019

Updated on Apr 28, 2022 at 11:16 am UTC by · 2 mins read

The strong bearish daily candle that broke down and closed below the $3,679 price level yesterday, followed by another bearish candle today implies that Bitcoin may find support at the previous low of $3,247.

Key Highlights:

  • Bitcoin price broke out of the ranging movement;
  • the Bulls lost the momentum on the 4-Hour chart;
  • there is a probability for further declination of BTC price.

BTC/USD Long-term Trend: Ranging

Resistance levels: $3,679, $4,237, $4,715
Support levels: $3,247, $2,765, $1,956Bitcoin Price Analysis: BTC/USD Trends of January 21–27, 2019BTC/USD is on a ranging phase on the long-term outlook. Last week, Bitcoin price experienced another consolidation phase after slow bearish movement. The bears could not push down the coin further as expected. The low BTC price level of $3,247 could not be reached. The bulls as well lost the momentum and were unable to push up the Bitcoin price beyond last week price. The BTC price started consolidating on the $3,679 price level. The coin is currently facing the $3,247 price level.

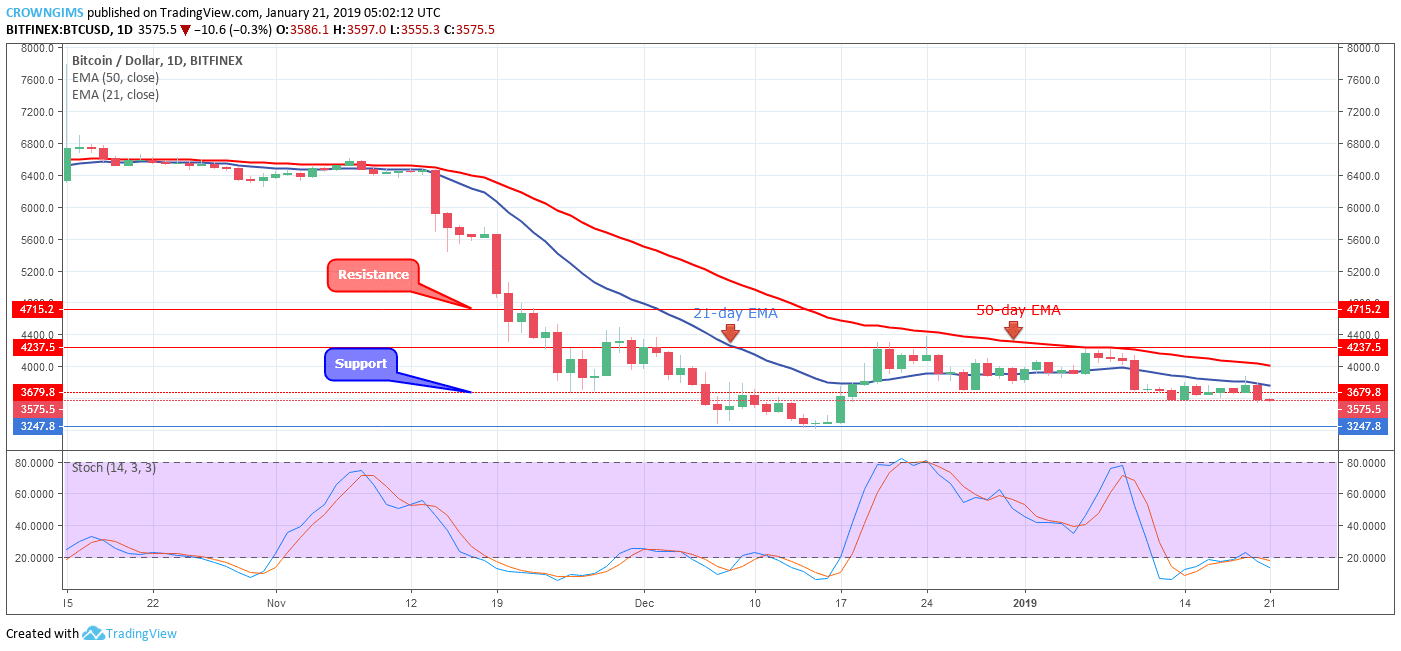
The 50-day EMA remain above the 21-day EMA while the BTC price continues trading under the later which indicate that the bears were still holding to the BTC market. The Stochastic Oscillator period 14 is below 20 levels (at the oversold level) with its signal lines pointing down connotes further declination of BTC price and sell signal.

The strong bearish daily candle that broke down and closed below the $3,679 price level yesterday, followed by another bearish candle today implies that the coin may find support at the previous low of $3,247.

BTC/USD Medium-term Trend: Bearish

Bitcoin Price Analysis: BTC/USD Trends of January 21–27, 2019BTC/USD is bearish on the medium-term outlook. The bullish momentum pushed Bitcoin price from the $3,679 former support level towards the high of $4,237 price level last week before it was resisted from the further increase. The bears gained enough pressure and push the coin back to its previous low after broken down the barrier at $3,679 price level and that of dynamic support and resistance.

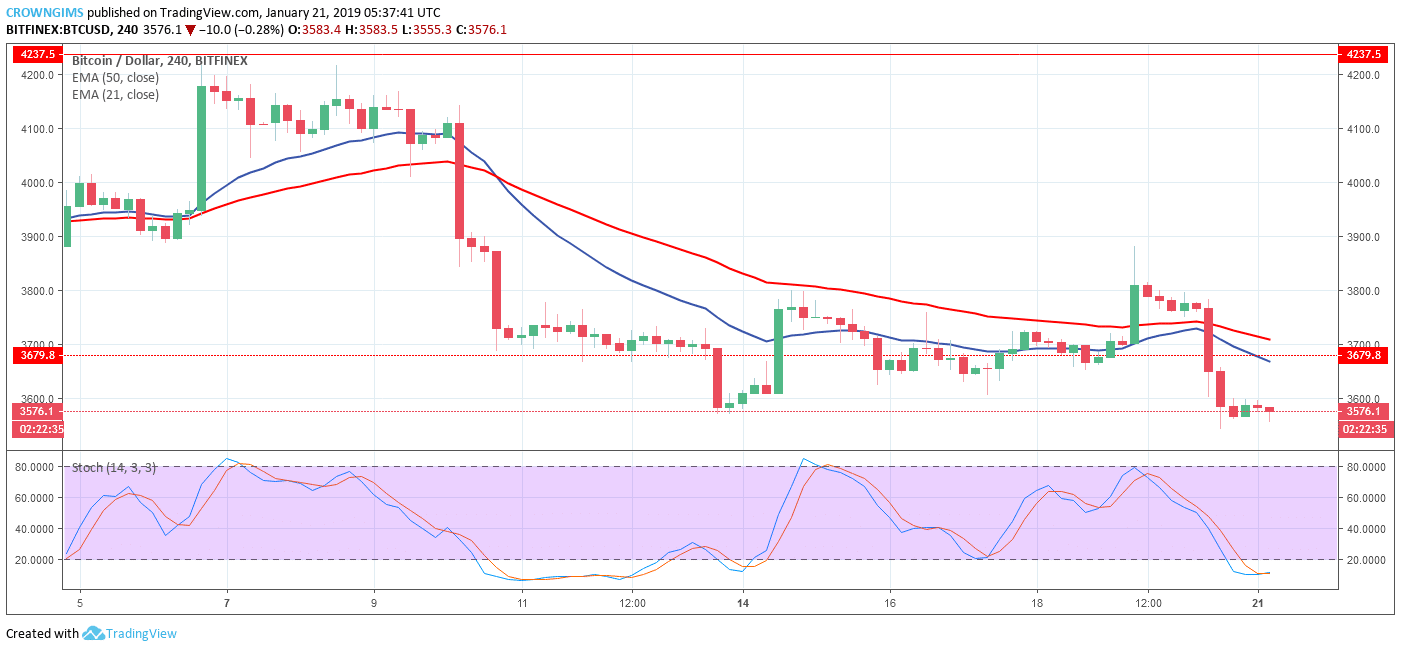
The coin is trading below the 21-day EMA and 50-day EMA with the two EMAs bending to the south as a sign of bears’ pressure. However, the stochastic Oscillator period 14 is below 20 levels (oversold level) twisted to each other and flat horizontally which indicates that the coin may experience consolidation for a short period of time.

Share:

Related Articles

Bitcoin Selling Pressure on the Rise: What to Expect?

By April 4th, 2025

Bitcoin recently saw a major unstaking event, long-term holders’ movement, and looming Bitcoin options expirations, all contributing to potential price volatility.

Arthur Hayes Explains Why Trump Tariffs Are Good for Bitcoin

By April 4th, 2025

BitMEX co-founder Arthur Hayes argues that Trump’s reciprocal tariffs will ultimately benefit Bitcoin by weakening the US dollar and increasing the demand for alternative assets.

Bitcoin ETFs Saw $220M in Inflows Despite BlackRock’s Selloff, Trump’s Tariff War

By April 3rd, 2025

US-based spot Bitcoin exchange-traded funds recorded an impressive surge in inflows while the leading product saw $116 million in outflows amid the United States tariff war.

Exit mobile version