Bitcoin has again dipped to $76,900, driven by rumors of potential BTC liquidation by Strategy while experts expect a market rebound once macro tensions ease.
Bitcoin fell by over 9% since the Trump’s Liberation Day announcement, dropping to $76,900.
Rumors are circulating that Strategy might liquidate some of its BTC holdings.
Santiment predicts a sharp recovery in the crypto market once macroeconomic tensions ease.
After a brief touch of $80,200 on April 8, Bitcoin BTC$84 89824h volatility:1.3%Market cap:$1.69 TVol. 24h:$22.64 B
has fallen back to $76,900, down more than 9% since the Trump’s Liberation Day announcement. Earlier today, prices dipped as low as $74,250, wiping out nearly 3% of the cryptocurrency’s market cap in just 24 hours.
On April 7, China offloaded $50 billion in US Treasuries, retaliating against US tariffs. The very next day, Washington responded with a steep 104% tariff hike on Chinese imports. This move has left all financial markets, crypto included, directionless.
As per a recent Santiment’s X post, traditional indicators may not behave as expected until there’s clarity on the tariff situation or until retail investors begin aggressively shorting or selling off assets. So far, neither scenario has taken shape.
🇺🇸🇨🇳 The tariff situation showed a brief period of brightness today, as Bitcoin reached $80.2K again and the S&P 500 started up on the day by ~+4%. However, no notable positive progress has been announced on tariff negotiations. Developments of note:
Meanwhile, there have been persistent rumors that the largest corporate Bitcoin holder, Strategy, may be preparing to liquidate some of its BTC holdings.
⚠️ STRATEGY MAY BE FORCED TO SELL BITCOIN, BREAKING 'HODL' PLEDGE
In a recent 8-K filing with the SEC, Strategy may be forced to sell its #Bitcoin to meet debt obligations if $BTC prices continue to decline – potentially breaking Michael Saylor’s @saylor long-standing "never… pic.twitter.com/GfLPMmd2SP
— Cult of Blockchain (@BlockchainCult) April 9, 2025
An 8-K form allegedly filed with the SEC on April 7 hints that if Bitcoin continues to trend downward, the firm could be forced to sell to cover debts.
Additionally, BlackRock’s iShares Bitcoin Trust (IBIT) offloaded 3,296 BTC on April 8, making it the third-largest single-day outflow in its history.
BTC Price Outlook
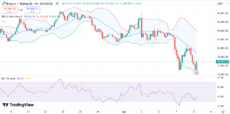
On the BTC 4-hour price chart, the RSI stands around 40, indicating that the leading cryptocurrency is approaching oversold territory, though not fully there yet.
If RSI drops further, traders could see a bullish reversal. Investors should watch resistance around $80,000, a psychologically key level and the recent high.
USDT price | Source: Trading View
Meanwhile, the Bollinger Bands show Bitcoin touching the lower band earlier today, which is often a sign that the price is stretched to the downside. This could lead to a short-term rebound, particularly if candles begin to close above that lower boundary.
However, failure to reclaim the middle band (around $78,900) could prolong the downtrend.
Notably, CryptoElites claimed on X that Bitcoin has now “entered the bottom zone”, hinting that the market could see a spike in the near future. They believe the market has reset its leverage and may soon re-enter an accumulation phase.
Santiment echoed a similar view, suggesting that once macroeconomic tensions subside, the crypto market could witness a rapid and aggressive recovery. However, they cautioned that investors can expect wild swings until a global tariff solution is reached.
📊 Based on mid-term timeframes, average trading returns are now unsurprisingly showing 'Opportunity Zones' for the majority of altcoins. As tariffs have wreaked havoc on the crypto sector, the @santimentfeed MVRV Divergence model shows that assets have racked up heavy enough… pic.twitter.com/BVrajUDVRo
Disclaimer: Coinspeaker is committed to providing unbiased and transparent reporting. This article aims to deliver accurate and timely information but should not be taken as financial or investment advice. Since market conditions can change rapidly, we encourage you to verify information on your own and consult with a professional before making any decisions based on this content.
A crypto journalist with over 5 years of experience in the industry, Parth has worked with major media outlets in the crypto and finance world, gathering experience and expertise in the space after surviving bear and bull markets over the years. Parth is also an author of 4 self-published books.