
In the short term, Bitcoin’s recent sharp drop and an RSI below 30 suggest it might be oversold, which could lead to a potential rebound soon.
Bitcoin (BTC) has had a tough August, with its price dropping more than 13% to as low as $50,000 in just the first few days. This decline is due to several factors, including the unwinding of the yen, carry trades and concerns about the US economy.
Despite this, two key indicators suggest BTC could be strong in the long run.
Positive Outlook from Long-Term Options
One positive sign is the sustained optimism in Bitcoin’s long-term options market. Data tracked by cryptocurrency platform Amberdata shows that Bitcoin’s 180-day call-put skew remains high, indicating confidence in its price strength over the next six months. This skew measures the demand for call options versus put options. A positive skew means investors are paying more for calls, reflecting a belief that Bitcoin price will rise.
Call options allow investors to buy Bitcoin at a set price in the future, while put options let them sell at a set price. The current positive skew suggests that investors expect Bitcoin price to go up, which is a good sign for its long-term performance.
Buying Pressure on US Exchanges
Another encouraging factor is the buying activity on US exchanges. Despite recent price drops, data from Kaiko shows that buying activity on platforms like Coinbase, Gemini, and Kraken has been strong. This is measured by cumulative volume delta (CVD), which tracks the difference between buying and selling volumes. A positive CVD indicates more buying than selling, suggesting that traders are taking advantage of lower prices.

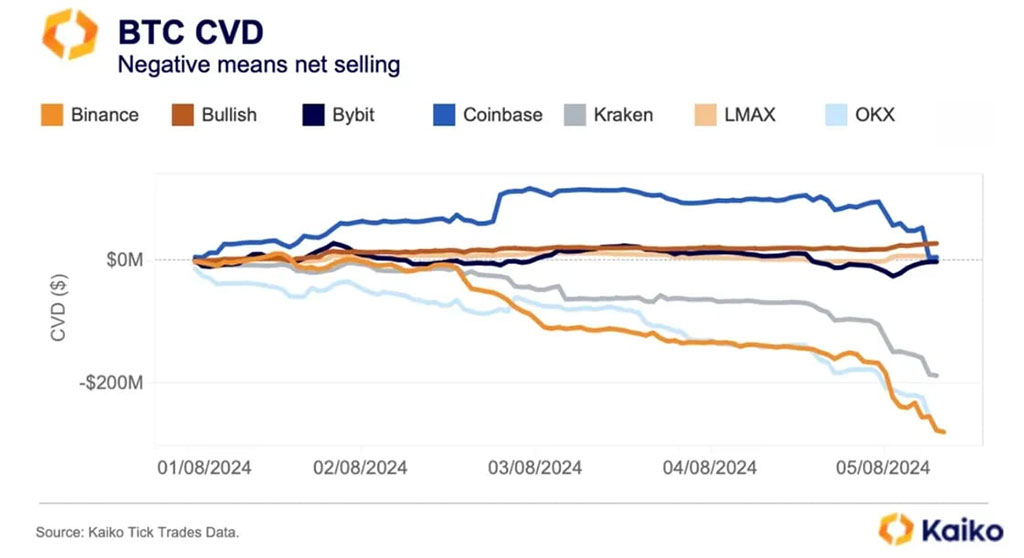
Photo: Kaiko
While offshore exchanges like Binance and OKX have seen more selling, the positive CVD on liquidity-rich US exchanges indicates that many traders, including institutional ETF issuers, are buying Bitcoin during the dip, which could help support its price.
Other Technical Indicators and Historical Trends
In the short term, Bitcoin’s recent sharp drop and an RSI below 30 suggest it might be oversold, which could lead to a potential rebound soon. Historically, such conditions have often preceded short-term recoveries, indicating that Bitcoin might stabilize or improve in the near future.
For the long term, Bitcoin remains in an upward trend channel, with key support levels around $45,000 and resistance at $70,000. This positive trend suggests that, despite recent declines, Bitcoin’s overall price trajectory has been upward.
This pattern is similar to Bitcoin’s behavior during the March 2020 market crash, when a significant drop was followed by a strong rebound as economic conditions improved. If current economic issues are resolved and conditions stabilize, Bitcoin could experience a similar recovery.
In summary, while Bitcoin faces short-term volatility, the long-term outlook is promising. Investors and traders are advised to stay cautious amidst current volatility but to keep an eye on Bitcoin’s long-term potential.
next